You’re probably thinking, “does the world really need another marketing framework?”
I get it.
Funnels.
Flywheels.
Matrices.
Maps.
Models.
Hierarchies.
Acronyms.
The list goes on.
But not a single growth framework to date can take you from a baby of a company to a category leader.
Because most growth frameworks ignore the most important growth lever of them all: market penetration.
And even better yet, not a lot of growth frameworks allow you to grow sustainably - meaning, that you don’t have to break the piggy bank to do so.
Unsurprisingly, market penetration, or selling to more of your total addressable market (TAM) over time, is the exact lever marketers and brands struggle with most.
After numerous client interviews, data we've gathered across our many clients, and well respected marketing research, we realized that being a strategic partner (and a proactive one for that matter) in today’s world needed a framework that could solve for a LOT of things.
Things like…
- Shorter term goals:
- Cleaning up revenue leaks in ad platforms and other marketing efforts
- Making true business impact through marketing (growing revenue, profit, pipeline, etc)
- Improving LTV:CAC ratios
- Resonating by improving messaging and positioning
- A clearer understanding of your company’s marketing journey and next steps
- Etc
- Longer term goals:
- Establishing a favorable competitive position/developing competitive advantages
- Growing market share
- Becoming a category leader
- Etc
To solve for nearly ALL the issues a marketer encounters (regardless of the stage the company is in) we’ve built our Marketing Maturity Mountain™: a sustainable growth framework that, for the first time, plots the five core maturity stages a business and its marketing must pass through to increase market penetration and sustain growth long term.
AND, that allows you to tackle any goal you might have today, regardless of it being a business goal (revenue/profit) or a marketing activity goal (cost per conversion, cost per click, etc).
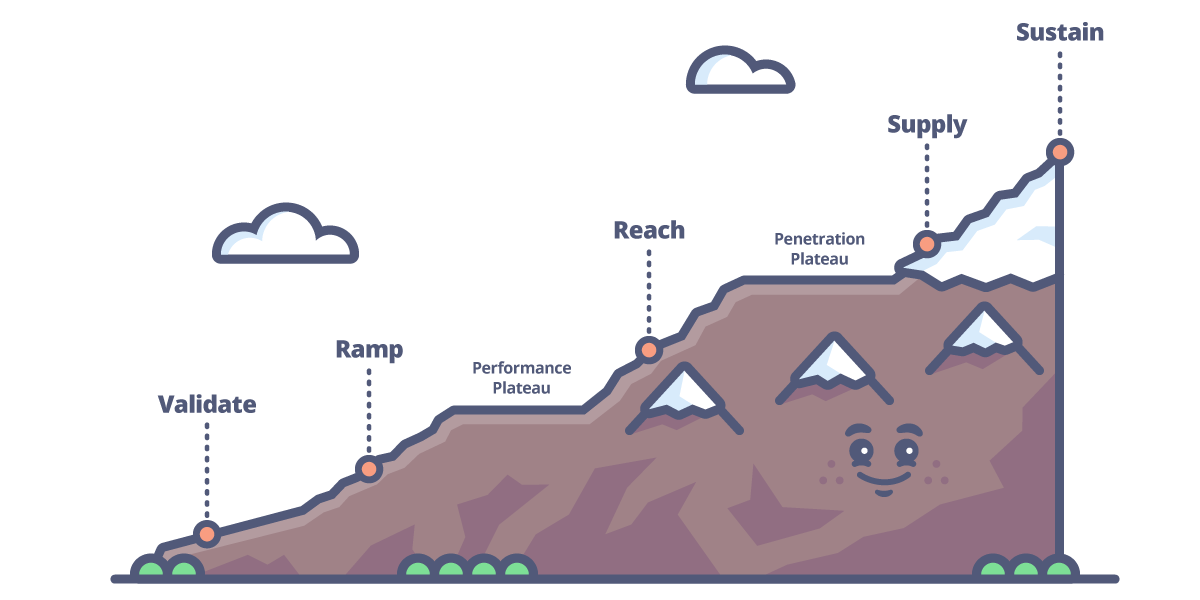
And not only that, we’re breaking down what the growth stages mean, along with:
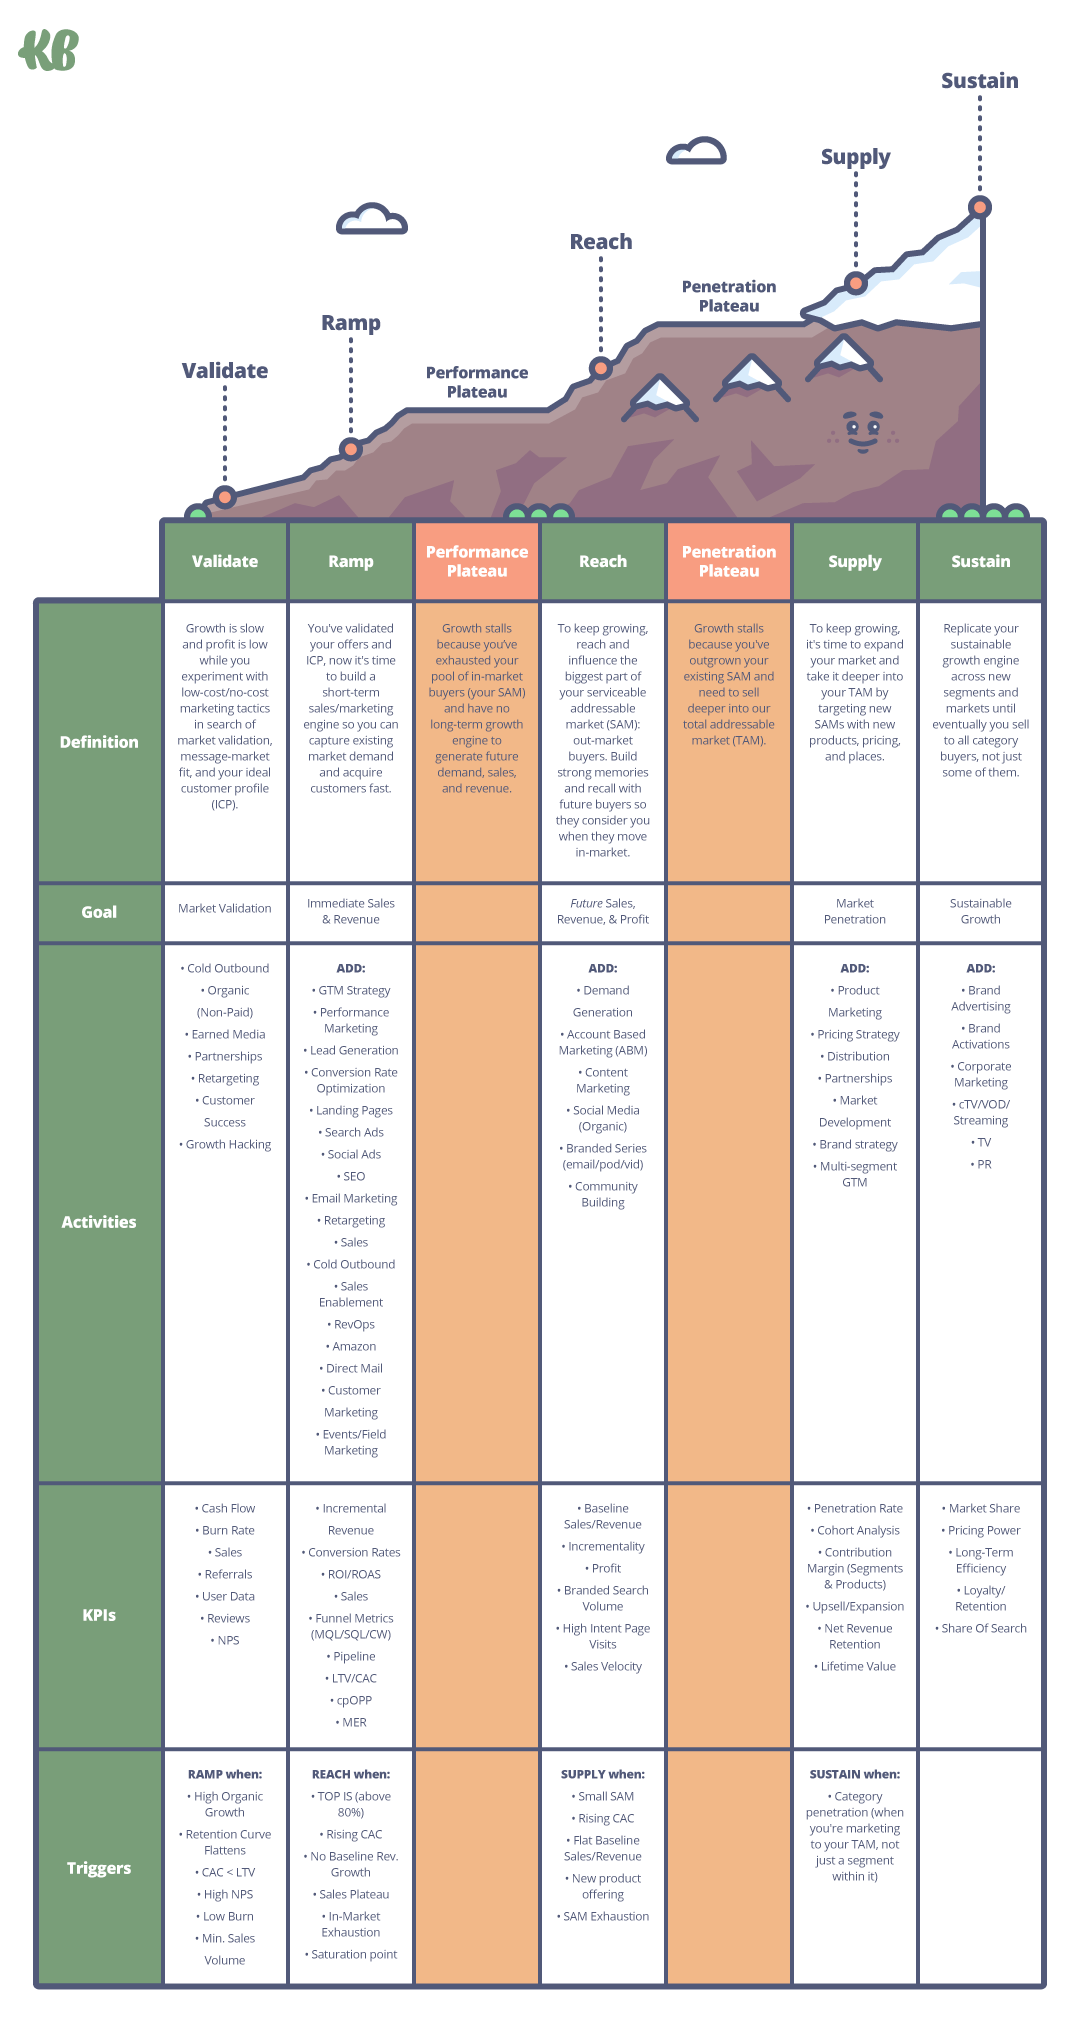
- Definition: What it means to be at any given stage of the mountain.
- Goal: What we’re wanting to achieve at this stage.
- Penetration Level: We’ll show you how your buying pool expands from stage to stage until eventually you sell to most, if not all, of your TAM.
- Marketing Activities: These are the marketing activities that you’d be focusing on during a certain stage on the mountain, like:
- Demand Capture vs Demand Generation
- Paid Ads (Search, Social, etc)
- Conversion Rate Optimization
- Account Based Marketing
- Partnerships
- Product Marketing
- Brand Advertising
- etc…
- Demand Capture vs Demand Generation
- KPIs: These are the key performance indicators you’re gonna want to improve while you’re at that stage, broken down by marketing activity (Google Ads will have different KPIs than ABM for example).
- Triggers: These are the KPI ranges you want to achieve BEFORE you know you’re ready to graduate to the next stage on the Marketing Maturity Mountain™.
Here’s the broader detailed breakdown for you to see how it’s all laid out:
In a sense, you could think of the Marketing Maturity Mountain™ as a video game.
You focus on quests (the marketing activities) to gain experience (the KPIs) that then allow you to reach new levels (the triggers).
Oh, and did we mention, every single marketing activity, KPI, and trigger on the Marketing Maturity Mountain™ will reflect your broader business impact goals (revenue and/or profit)
Get brand new marketing strategies straight to your inbox. 23,739 people already are!
Ready to climb?
Stunted Growth: What To Do Now
Over the last decade and a half, brands have grown increasingly enamored with small markets that deliver fast, efficient growth at the expense of bigger markets that deliver slower, sustainable growth.
It looks like one or all of the following:
- Prioritizing in-market buyers (5%) instead out-market buyers (95%)
- Performance marketing over demand generation
- Immediate revenue over future revenue
- Target accounts (1:1) over target markets (1:All)
- Existing customers over new customers
- Niche segments over broad categories
Instead of expanding our pools of buyers over time, we’re shrinking them for the sake of more and more efficiency - and running headfirst into a growth plateau when those shrinking pools run out of buyers (or fill up with too much competition).
Because so many brands are competing for JUST the in-market (5%) buyers, they:
- Have a very hard time differentiating themselves from competitors over the long haul
- Hit growth plateaus faster
- Suffer from rising CACs (since you and everyone else is competing in a much smaller market of buyers)
We’re not saying that small markets don’t matter or that they don’t deliver growth.
They do.
And it IS hard to imagine an effective marketing program that ignores in-market buyers, target accounts (B2B), immediate revenue, existing customers, and niche segments.
But small markets of buyers are, well, small.
They also dry up fast and/or have little to no scalability.
And when they do, sales dry up with them.
The solution?
Growth is less like a straight line “up and to the right” and more like a jagged mountain edge with peaks and valleys and occasional plateaus (hence the mountain metaphor).
So when we say “sustainable growth,” we don’t mean hockey stick growth without pause; we mean a jagged mountain edge with peaks and valleys, but one with a summit that is always getting BIGGER.
Brands need to expand their pool of potential buyers over time, from existing customers to new customers, in-market buyers to out-market buyers, niche segments to all category buyers, until eventually they sell to all category buyers (the highest summit on the mountain).
Market Penetration: The Road To Sustainable Growth
To understand sustainable growth, first you need to understand the core concept underpinning it: market penetration.
What’s market penetration?
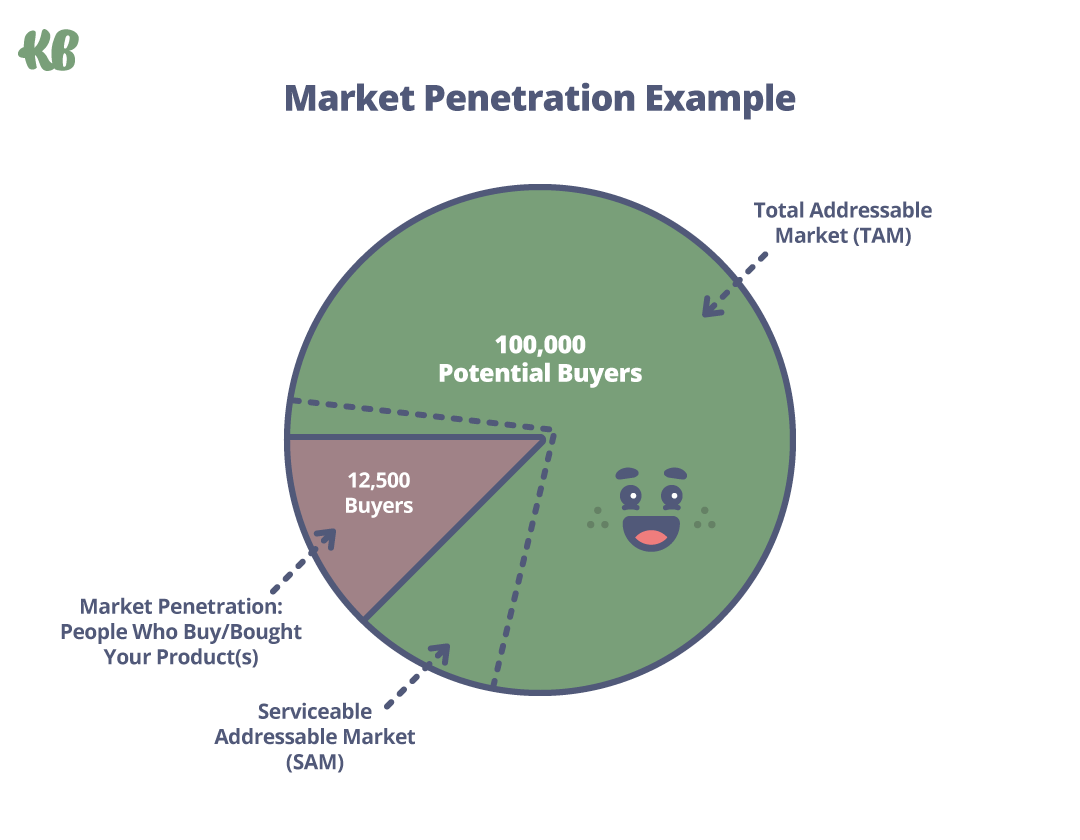
Market penetration refers to the percentage of the market that you currently sell your products or services to compared to the total addressable market (TAM) for your products or services.
For example, if you sell to a market of 200,000 potential buyers and 25,000 of them use your product, then you have a market penetration rate of 12.5% (and lots of room to grow).
According to research from Les Binet and Peter Field, market penetration is the main driver of very large business effects: market share, sales, revenue, pricing power, profit, and loyalty.
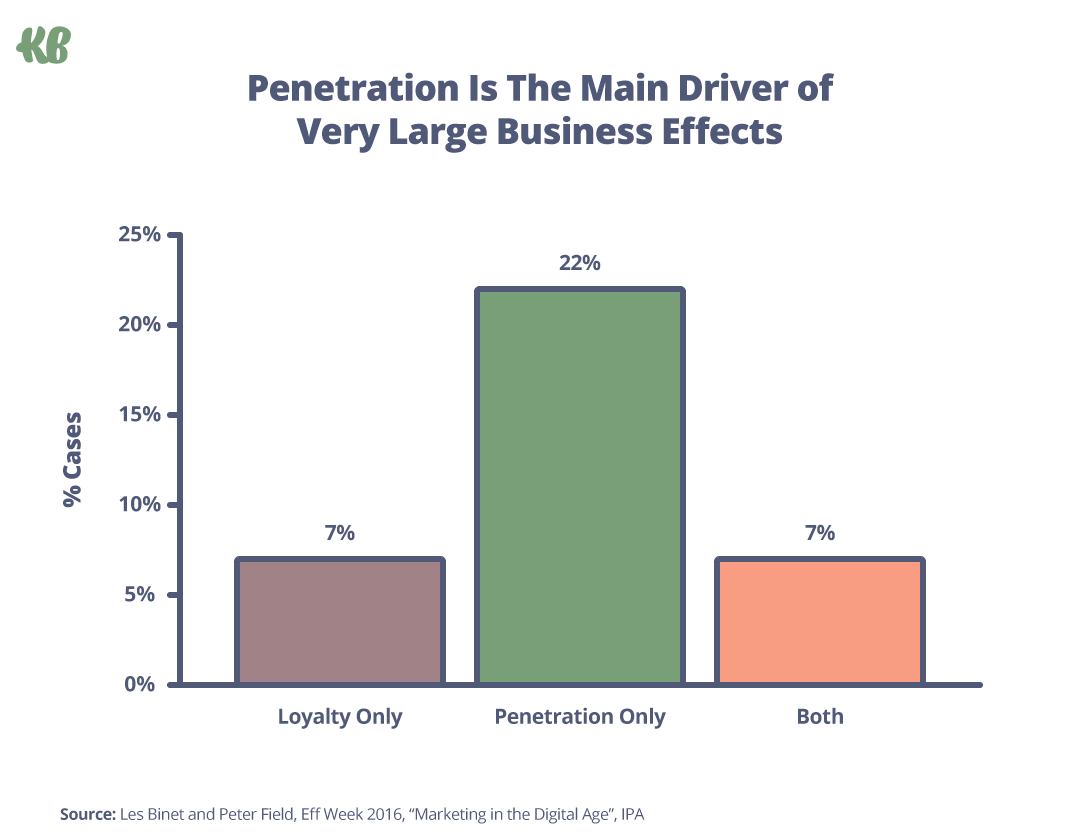
Why is penetration the main driver of very large business effects?
A few reasons…
Let’s start with the obvious: the brand with the highest penetration rate sells to more new customers than any other brand in the category.
We can’t overstate the “new customer” part enough.
Though it’s hard to maintain growth if you can’t retain customers or keep them coming back, new acquisition is the key driver of sustainable growth, not existing customers.
That’s because existing customers make up the smallest pool of potential buyers whereas new customers make up the biggest. It’s simple math - and highly penetrating brands know it.
Stick with us as this may seem obvious.
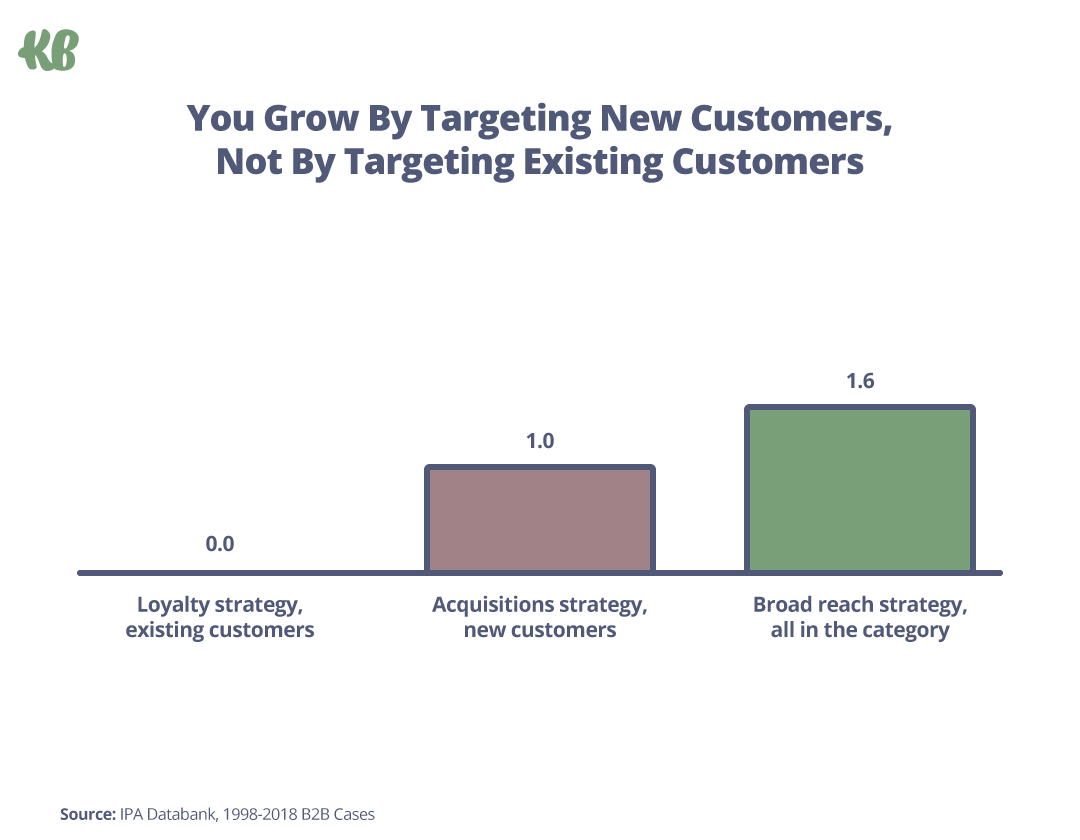
The “not-so-obvious” part is that highly penetrated brands don’t just sell to new customers; they sell to the biggest pool of new customers in their total addressable market (TAM).
What’s a TAM?
Your total addressable market refers to the overall revenue opportunity you could achieve if you sold to 100% of the market.
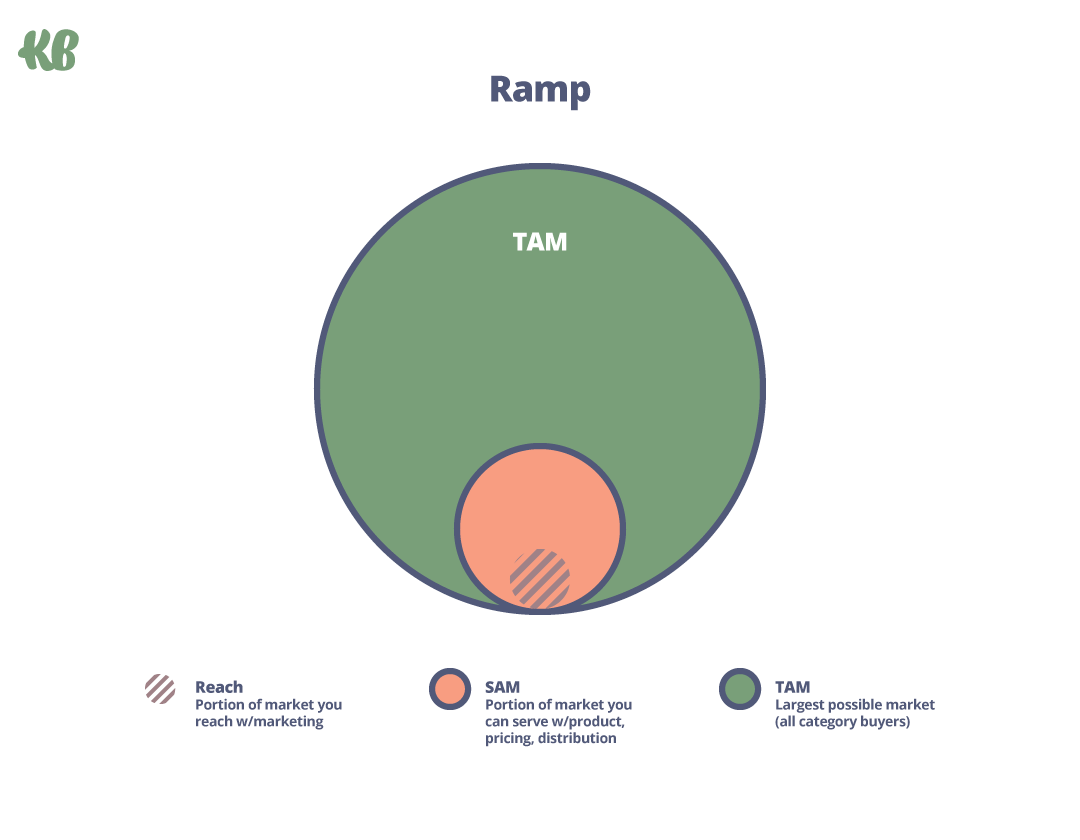
In other words, your TAM is made up of all category buyers from all segments and regions, globally. And it’s the largest pool of buyers you can possibly penetrate, even if you don’t have the products, pricing, and place (also known as distribution) to sell to them all right now.
For example, take Mailchimp.
Mailchimp owns the largest share of the market in the email marketing software category yet most would argue they’re the most un-differentiated brand of them all (we’re not talking about them having a monkey as a mascot here).
How can that be?
Unlike others in their category, Mailchimp has a portfolio of products, dynamic pricing, and a global brand that can reach and serve the most amount of buyers in their TAM.
Whereas segment specialists like Klaviyo only sell to eCommerce brands, Mailchimp sells to nearly all brands, freelancers, agencies, and solopreneurs - globally.
Therefore, Mailchimp’s pool of potential buyers TOWERS over Klaviyo, hence the reason Klaviyo’s market share sits at 9% and Mailchimp’s sits at 67%.
But what’s the recurring theme? Bigger pools of potential buyers.
To sustain growth long-term, you need to find ways to become more available for more buyers in your TAM at all times, until eventually you sell to all category buyers, not just segments, niches, regions, or channels. Otherwise you’ll hit a marketing and sales plateau when your small pool of buyers dries up.
Now how do you do that?
It takes a well-choreographed dance between two concepts: mental availability and physical availability.
A Choreographed Dance Between Mental & Physical Availability
You don’t just expand your buying pool overnight.
It takes a well-choreographed balance between two concepts first established by Byron Sharp and the Ehrenberg Bass Institute of Marketing Science: mental and physical availability.
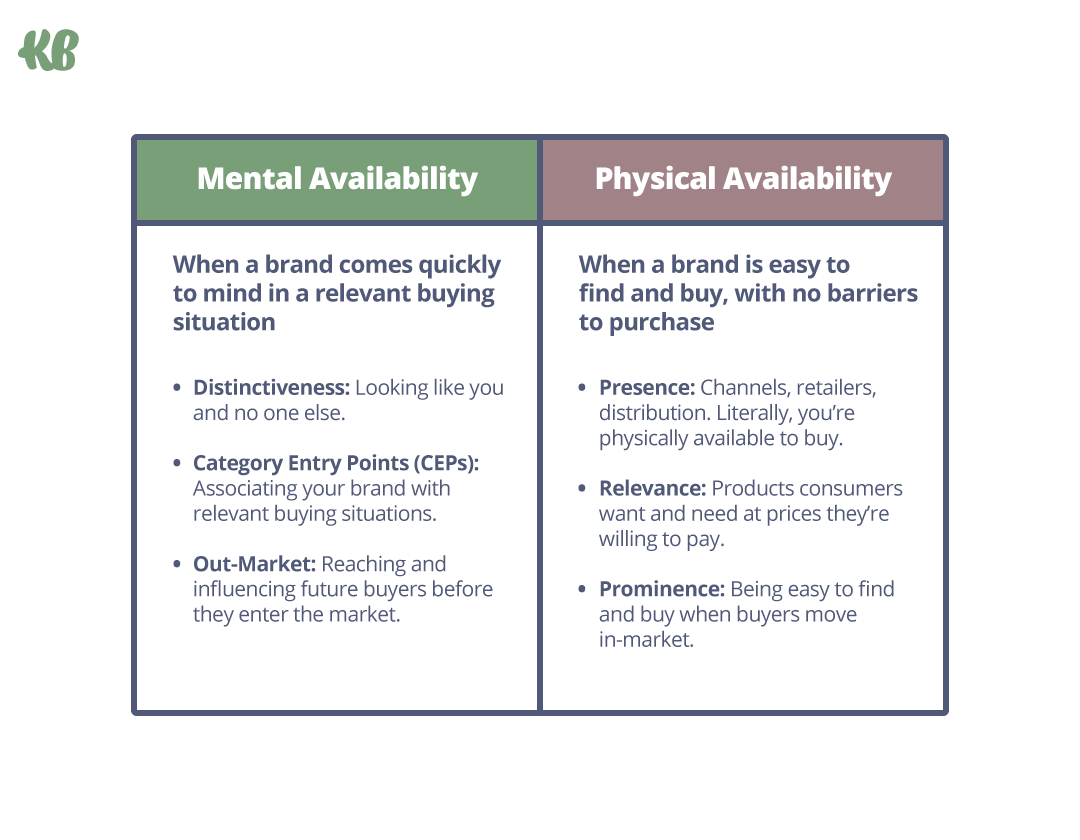
Mental availability is when a buyer knows you exist and considers you as an option BEFORE they enter the market for what you sell (commonly knows as brand awareness too).
So when they do enter the market, they won’t need to search Google for a solution; they’ll go directly to your website.
Physical availability is when you have the literal products (or services), pricing, and places (distribution) to serve the people who want to buy from you in the first place (we’re NOT talking about physical goods here, although that would be your product if you’re in eCommerce).
To expand your buying pool, you need to increase both over time (the mental and physical availability).
First, you need to become more salient (mental availability) for more people via marketing strategies and tactics.
In incredibly simple terms, you have to become more memorable than your competitors.
Second, you need to become more saleable (physical availability) for more buyers in your TAM via product, price, and place (we’ll talk more about that later).
For example, as a digital marketing agency here at KlientBoost, we have a HUGE TAM.
But just because hundreds of thousands of businesses exist that could benefit from our services, that doesn’t mean we can serve all of them right now.
For example, smaller businesses may need a lower price point, bigger businesses may need a more robust offering, and APAC businesses may need a different playbook than the US market.
Therefore, though our potential global market is huge, we only sell to a small portion of our TAM called a serviceable addressable market (SAM). More specifically, our SAM includes companies who:
- Make $5M+ in annual revenue
- OR who have 30+ employees
- OR who have $1M in funding
- AND sell product/services in English-speaking countries
- AND need one or more of our services
But eventually, we’ll outgrow our SAM.
And when we do, we’ll need to expand our buying pool by adding new services, or offering new price tiers, or entering new geographic regions.
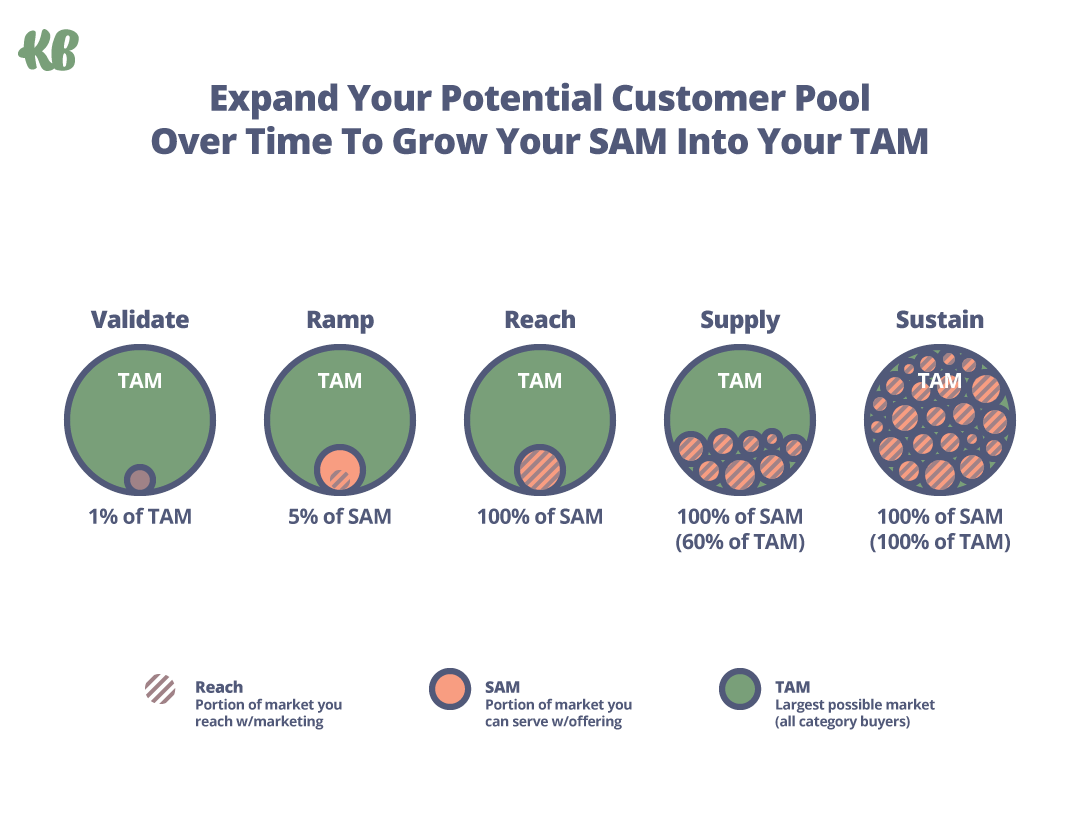
Within our SAM, we have both in-market buyers (classically focused on by demand capture marketing activities like Google Search Ads, Retargeting, etc) that make up about 5% of our SAM and we have out-market buyers (classically focused on by demand generation marketing activities Paid Social, Organic Social, ABM, Cold Outbound, etc) that make up about 95% of our SAM.
We’ll chat more about this later too.
Let’s look at another well-known example: Tesla.
When they arrived on the scene, they only sold one electric vehicle: a $109,000 Roadster.
Though the potential global TAM for electric vehicles was huge, Tesla could only serve a small sliver of the US market, making overall market penetration low no matter how well they did.
It wasn’t until the introduction of several cheaper electric vehicles and global distribution that Tesla sales began to soar.
Did Tesla magically re-invent electric vehicles along the way?
No.
But they progressively made electric vehicles more available for mainstream buyers with average incomes.
In other words, they expanded their SAM to cover more of their TAM.
And not just with new and cheaper car models, but with newer regions across the globe.
The result?
More market penetration.
So if sustainable growth requires market penetration, and market penetration requires an increase in both mental and physical availability, how do you manage all three over time?
Enter: The Marketing Maturity Mountain™
Marketing Maturity Mountain™: KlientBoost’s Sustainable Growth Framework

As mentioned, Marketing Maturity Mountain™ is a sustainable growth framework that, for the first time, plots the five core maturity stages a business and its marketing must pass through to increase market penetration and sustain growth long term.
Those five stages include:
- Validate
- Ramp
- Reach
- Supply
- Sustain
Plus two growth plateaus: the performance plateau and the penetration plateau.
What’s included in each stage we’ll cover below?
- Definition: What it means to be at any given stage of the mountain.
- Goal: What we’re wanting to achieve at this stage.
- Penetration Level: We’ll show you how your buying pool expands from stage to stage until eventually you sell to most, if not all, of your TAM.
- Marketing Activities: We’ll outline the core marketing activities of each stage. Note: You’re not replacing activities as you mature from stage to stage; you’re adding additional ones and maturing old ones.
- KPIs: We’ll explore the key performance indicators (KPIs) you should start measuring at each stage. Again, you’re not replacing KPIs as you grow from stage to stage; you’re adding additional ones.
- Triggers: Last, we’ll show you how to identify when you’re in either a performance plateau or penetration plateau so you know when it’s time to progress to the next stage.
Ready? Let’s go!
Validate Stage: The Path To Product-Market Fit & Message-Market Fit
The goal of this stage is “market validation”.
The validate stage of our Marketing Maturity Mountain™ looks like slow growth as you experiment with low-cost/no-cost marketing activities in search of market validation, message-market fit, and your ideal customer profile.
At this stage, companies don’t have the revenue, resources, or product-market fit to scale marketing programs efficiently and effectively.
Good news: they don’t have to.
Instead, early stage companies need to leverage creativity, resilience, and speed to earn attention, test segments, and turn feedback into product/service improvements until they discover their best fit buyer worth ramping.
Penetration Level
There’s two ways to enter a market and validate your offer:
- Niche focused: you build your product/service for a narrow segment of the market then promote it to that segment upon entrance.
- TAM experimentation: you build your product/service for all category buyers then test different segments to see who fits and who doesn’t.
Both work.
Though more often than not, early stage startups discover that their ideal customer is not who they thought it would be, which makes TAM experimentation a smart way to learn the truth.
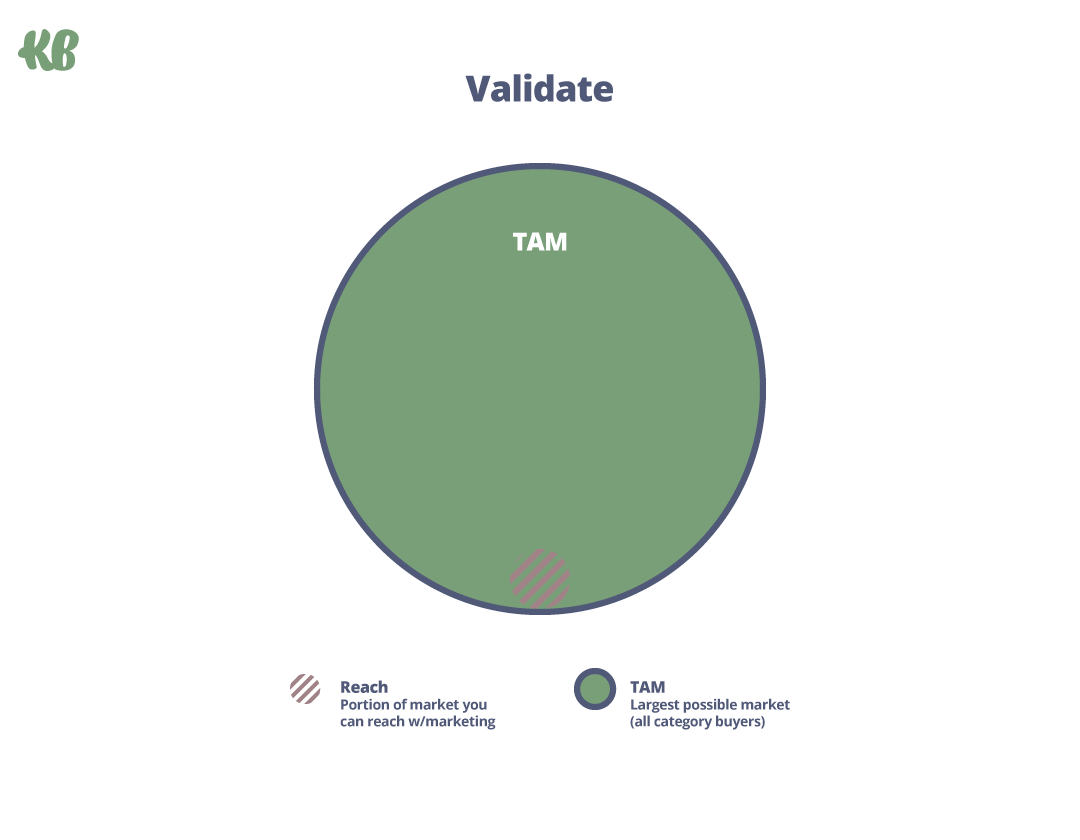
Either way, whether you validate with a single segment or validate with all category buyers, due to resource constraints (budget, capital, people, etc.), marketing only reaches a tiny sliver of your TAM at this stage.
Validate Marketing Activities
During validation, it’s critical that companies use limited resources to get in front of as many potential buyers as they can, no matter how unscalable those activities might prove long term.
For example:
- Message/Positioning Testing: It’s never too early (or too late) to start testing messages with your target market. Message-market fit is just as important as product-market fit.
- Email Marketing (B2B & B2C): You won’t need a highly sophisticated outbound engine to get interest, replies, and even sales. It can be a low cost, yet scrappy effort.
- Organic (Non-Paid): Founders may not have budget, but they do have time. Organic channels like social media, SEO, and communities reign supreme.
- Earned Media: What’s the best way to earn free media from industry experts, vendors, or influencers? Say something different. Startups can punch above their weight class by trumpetting a message their buyers need to hear but that nobody else is saying that is written about them by a 3rd party.
- Partnerships: Not just referral partnerships with adjacent vendors, but content partnerships that put you in front of your target market for free (e.g. webinars, podcast guest, guest posts, virtual events).
- Retargeting: Your low cost efforts may drive traffic, but one visit to your site or landing page isn’t enough to get a sale. Retargeting is a low-budget paid ads activity that can help educate your target audience to eventually become a customer.
- Customer Success: No better pool of buyers to learn from than the ones already paying you. You won’t have upsell, cross-sell, or expansion opportunities at this stage, but you will be able to gather feedback, iterate your product/service, and increase adoption.
- Growth Hacking: Catch all experimental marketing buckets that still respect the LTV:CAC KPI you’ll learn more about below.
Validate KPIs & Triggers
If the goal is product-market fit, then how do you know when you’ve achieved it?
- Messaging/Positioning: 75% focus group positive response rate.
- This can be tracked through tools like:
- Wynter.com: for B2B businesses
- UsabilityHub.com: for B2C businesses (more preference vs true focus group)
- This can be tracked through tools like:
- Email Marketing (B2B & B2C):
- B2B: 10% positive response rate.
- This can be achieved with tools like Apollo.io, Salesloft, Outreach, LinkedIn Sales Navigator, etc
- B2C: 3:1 LTV:CAC ratio
- B2B: 10% positive response rate.
- Organic (Non-Paid): 5:1 or 20% customer to customer referral rate.
- Earned Media: 10% quarter over quarter organic traffic growth (search engine, referral, social, and/or direct traffic) from 3rd party sources (that you can influence if you’d like).
- Partnerships: 1 sales or marketing partner per quarter as an organic (you didn’t have to pay for) symbiotic relationship with a BIGGER company than you. This shows interest and value from a 3rd party.
- Retargeting: Acquisition of customers respecting a 3:1 LTV:CAC ratio (more on that later).
- Customer Success:
- NPS = 9 or 10 promoter average
- Likert scale surveys = 4.5 towards “strongly agree”
- Reviews = 50% of customers (influenced or not)
- Business KPIs:
- LTV:CAC Ratio: When the cost of acquiring a customer (CAC) falls below lifetime value (LTV), you’re moving in the right direction. If you hit the magical 3:1 LTV:CAC ratio (you make 3x revenue what it costs to acquire), that’s a sure sign you’ve found a good fit customer and your product value is solid.
- Gross Margin: This should be strong IF you have to be profitable (meaning, you haven’t raised money). Look for 50%+ early gross margin IF you have very low overhead and cost. Sales volume and sales frequency can allow that gross margin to be much smaller.
- Cash Flow Ratio: This is your cash coming in divided by your liabilities (cash going out). That ratio should be 4:1 ($10 coming in, $2.5 going out) if you plan on operating profitably out of the gate (meaning, you haven’t raised money).
- Burn Rate: As you “grow” up the mountain, your cash flow ratio can suffer, that’s why it’s important to have a burn rate that respects a 6-12 month cash reserve.
- LTV:CAC Ratio: When the cost of acquiring a customer (CAC) falls below lifetime value (LTV), you’re moving in the right direction. If you hit the magical 3:1 LTV:CAC ratio (you make 3x revenue what it costs to acquire), that’s a sure sign you’ve found a good fit customer and your product value is solid.
Here’s the interesting thing…
70%+ companies skip many steps in the validate stage and they can still achieve success.
Many companies can also skip some stages on the mountain entirely and still see success.
The important part is that if you do skip things, it means you’re playing the game on “hard mode” when you could have it much easier.
By ignoring NPS for example and not having it be in the 9 to 10 promoter range, you’re going to have retention issues, and therefore, your climb up the mountain will be slower than a competitor who is obsessed with NPS.
So what’s next after the validate stage?
It’s time to start spending money and ramping sales.
Ramp Stage: In-Market Exhaustion
The goal of this stage is “immediate revenue and/or profit”.
By this stage, you’ve validated your business model, defined your ICP, and narrowed in on a serviceable addressable market (SAM). Now it's time to build a short-term marketing engine so you can drive fast revenue (or profit).
The goal at this stage?
In-market exhaustion.
Oftentimes, brands at this stage introduce product complexity too early or spread their limited resources too thin when they should be asking themselves: how can we capture demand efficiently as it falls and turn in-market buyers into customers?
Simple.
It doesn’t make sense to invest in future demand (out-market buyers) until you know how to convert existing demand.
Why fill the top if you have leaks in the bottom?
You’ve got revenue coming through the door, and you’ve found a segment of the market that loves your product. Now turn as many of those active buyers into customers as possible.
Penetration Level
Based on research from the Ehrenberg Bass Institute of Marketing Science, roughly 5% of buyers are in-market at any given moment whereas 95% of potential buyers sit out-market. It’s called the 95:5 Rule.
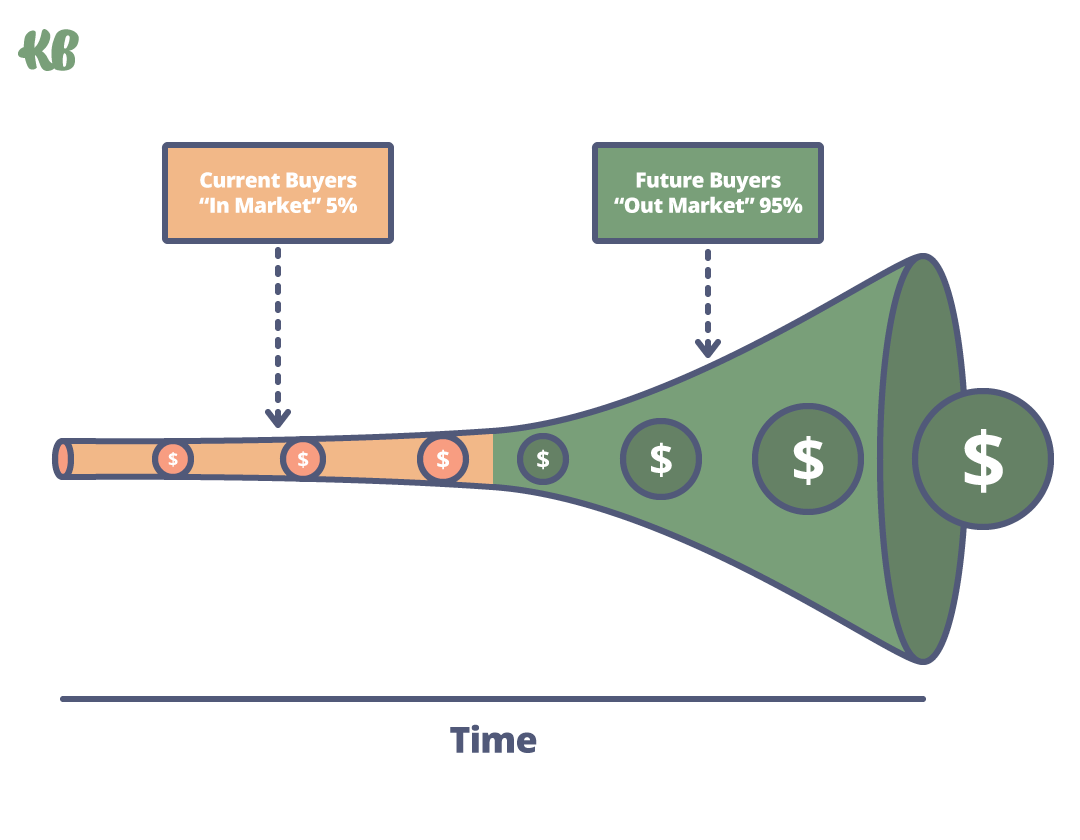
So though you’ve established a SAM that you validated in the previous stage, since the Ramp stage focuses on the active market (in-market buyers), you’re only reaching 1-5% of your serviceable market with your marketing, give or take.
A sliver (SAM) of a sliver (in-market).
A bigger pool of buyers than the validate stage, but still a ways to go.
Ramp Marketing Activities
Remember, these activities in the Ramp stage are in ADDITION to what you’ll keep doing from the Validate stage.
So what marketing activities will help you drive immediate revenue and/or profit at this stage?
- RevOps (B2B)/Data Ops (B2C): Now is a perfect time to build a reliable tech stack for measuring marketing performance to revenue and aligning marketing, sales, and customer success. Think about attribution improvements, conversion tracking, CRM sales stage tracking, UTMs, etc.
- Ad Platforms: Google Search ads, shopping ads, social ads, and marketplace ads (e.g. Amazon). Get in front of buyers where they’re looking to buy now. Simple.
Keep in mind that your LTV:CAC ratio needs to still be that magical 3:1 ratio.- Google Ads Search:
- Search Campaign Structure:
- General (launch, 1st priority)
- Competitor (launch, 2nd priority)
- Brand (launch, 3rd priority)
- Informational (keep paused)
- Observation Mode Audiences Layered on Search Campaigns:
- In-Market
- Affinity
- Custom Intent
- Broad General Search Campaign + In-Market (Targeting mode, if applicable)
- YouTube Retargeting Campaign
- Search Campaign Structure:
- LinkedIn Ads:
- Awareness/Consideration Objectives w/ ICP Filters (TOFU) = 50% of Budget
- Lead Generation or Conversion Campaign Objective w/ ICP Filters (BOFU) = 50% of Budget
- Web Traffic Retargeting Campaign w/ ICP Filters (BOFU)
- Engagement Retargeting Campaign w/ ICP Filters (BOFU)
- Prospects that have engaged with ads (watched, clicked-through, etc)
- Warchest of Ads
- Enough variety of benefits, features, etc to not achieve creative ad fatigue too quickly
- Enough variety of benefits, features, etc to not achieve creative ad fatigue too quickly
- Meta Ads (Facebook/Instagram):
- Lead Generation or Conversions Campaign Objective (TOFU) = 70% of Budget
- Requires 3rd party audience tool like Metadata if you’re B2B
- Lead Generation or Website Conversion Campaign Objective (BOFU) = 30% of Budget
- Web Traffic Retargeting Campaign w/ ICP Filters (BOFU)
- Engagement Retargeting Campaign w/ ICP Filters (BOFU)
- Prospects that have engaged with ads (watched, clicked-through, etc)
- Warchest of Ads
- Enough variety of benefits, features, etc to not achieve creative ad fatigue too quickly
- Lead Generation or Conversions Campaign Objective (TOFU) = 70% of Budget
- Google Ads Search:
- Conversion Rate Optimization: Make your in-market marketing spend work harder by converting more visitors into customers. This is done by landing page and/or website split testing to increase your conversion rates.
- Sales (B2B): Document your sales process, experiment with demo flows, objection handling, automate email sequences, and reduce friction in the buying process.
- SEO (Low Funnel): Search engine optimization takes time, so it pays to start early, especially by building out web pages that rank for purchase-intent keywords (think of the Google Search ad keywords you’d target, but instead, you’re creating organic content to rank for those keywords).
- Email Marketing (B2B & B2C): This is where you can do even more than what you did in the Validate stage. Cold outbound for B2B still works tremendously well and is relatively low cost (minus the sales rep headcount). For eCommerce, most people don’t want a deluge of discounts and special offers via email if they’re not in-market, which is most of the time. But email as a direct response channel works well to re-engage abandoned carts.
- Product Marketing: Everyone in the business is a product marketer at this stage of maturity. Customer research, competitive research, market analysis, customer marketing, sales enablement, positioning, messaging, closed won/loss analysis, website, etc.
- Direct Mail: Depending on your SAM, if direct mail can work, this is when you should run some tests for this.
- Review Platforms: Review platforms like G2, Clutch, Amazon, Google, etc need to be a stronger part of your strategy as those platforms attract a lot of in-market buyers.
Ramp KPIs & Triggers
If the goal is short-term, rapid sales and/or profit, how do you know you’re effective?
- Carry Over KPIs & Triggers From Previous Stage(s): Continue to maintain those KPIs and triggers within the marketing activities of the Validate stage (example: 3:1 LTV:CAC ratio).
- RevOps (B2B)/Data Ops (B2C): 90%+ accurate conversion tracking between analytics, ad, and CRM/back end platforms.
- Ad Platforms:
- Google Ads Search:
- 3:1 LTV:CAC Ratio
- In-market Keyword Impression Share: 75%+
- Search Term Wasteful Spend: <10%
- Account Conversion Volume: ≥15/mo
- Google Ads Search:
- LinkedIn Ads:
- 3:1 LTV:CAC Ratio
- Ad Frequency
- 7 Day Audience: 5+
- 30 Day Audience: 10+
- 90 Day Audience: 20+
- Meta Ads (Facebook/Instagram):
- 3:1 LTV:CAC Ratio
- Ad Frequency
- 7 Day Audience: 5+
- 30 Day Audience: 10+
- 90 Day Audience: 20+
- Conversion Rate Optimization:
- SaaS and/or lead gen: 5-10% conversion rate
- eCommerce: 2-3% conversion rate
- Sales (B2B): Conversion rates through each stage of the sales funnel, pipeline velocity (how fast sales move through pipeline), and win rates allow you to maintain the 3:1 LTV:CAC ratio.
- SEO (Low Funnel): 2% click-through rate on low funnel keywords (seen through Google Search Console)
- Email Marketing (B2B & B2C):
- B2B: 3:1 LTV:CAC ratio
- B2C: 3:1 LTV:CAC ratio
- Direct Mail: 3:1 LTV:CAC ratio
- Review Platforms: 50% of customers are leaving reviews
- Business KPIs: Already at this point, the type of business and type of product it sells varies wildly. This is where you need to be somewhat educated financially to make sure your unit economics are sustainable.
How long can you stay in the Ramp stage? It depends on the size of your TAM.
For businesses with huge TAMs, it’s common to scale to $10 million in revenue (sometimes more) purely on in-market buyers. But for those with small TAMs, the Ramp stage is much shorter.
For us at KlientBoost, we’ve been able to continue to grow past $20 million in revenue while still focusing heavily on our original SAM.
Either way, if you stay in the Ramp stage too long, you’re bound to hit a performance plateau.
Performance Plateau: Addicted To Today’s Buyers
Alas, we made it to our first plateau: the performance plateau.
First presented by Tom Roach and Dr. Grace Kite, you hit a performance plateau when growth stalls, CAC rises, and nothing works like it used to because you've out-grown your pool of in-market buyers.
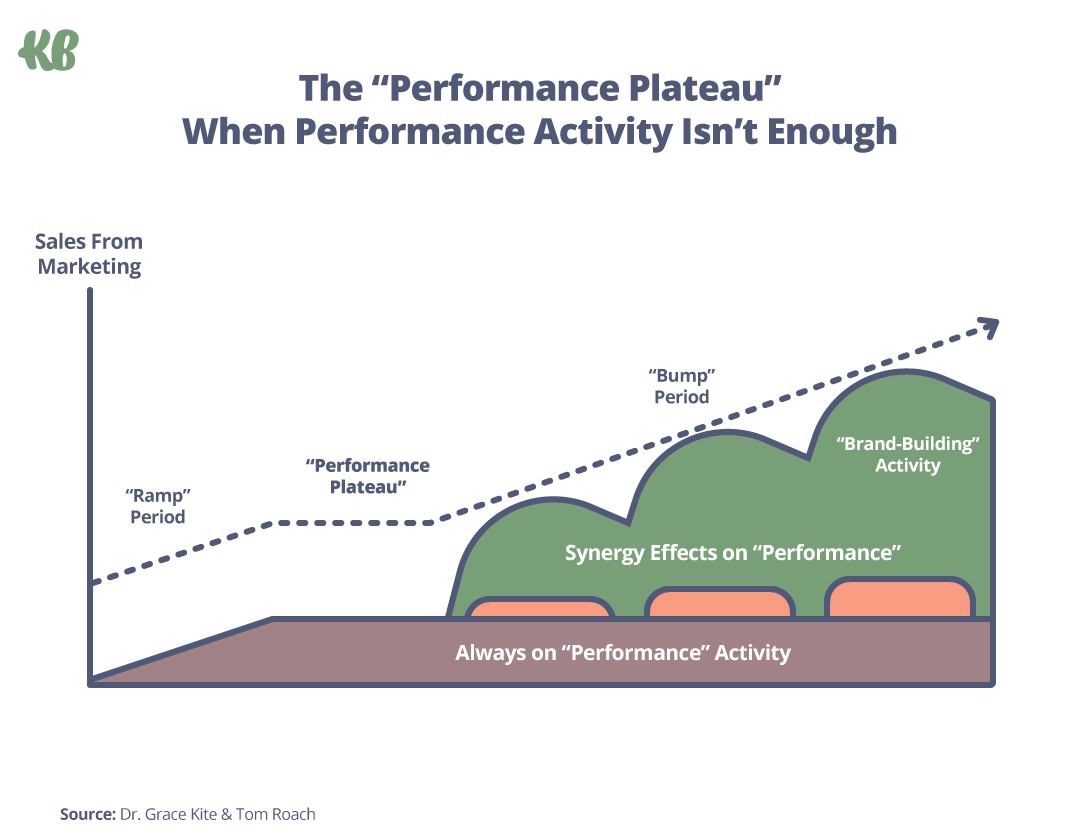
How common is a performance plateau? More common than anything else we’ve seen.
Over the last decade, digital ad channels have made it more efficient than ever to capture demand as it falls.
Consequently, marketers have fallen into a short-term, ROI-obsessed trap: in search of rapid growth, we over-invest in the “in-market” part of the market at the expense of generating future demand, sales, and revenue in the passive market (the “out-market” part).
Marketing has shifted away from a discipline that builds brand and accelerates demand to a discipline that supports immediate sales.
As sales and revenue targets get bigger, competition increases, and more and more buyers go directly to the established brand in the category upon entering the market, the portion of in-market buyers that you can feasibly capture for yourself shrinks.
And you hit a sales plateau.
Performance Plateau Triggers
How do you know you’ve hit a performance plateau and it’s time to enter the Reach stage of maturity?
- In-Market Exhaustion: A good indicator of maxing out your in-market portion of a SAM is if you Google Ads Search impression share is 80% or higher.
- Rising CAC: CAC is rising because you’ve reached a saturation point with your marketing activities. You spend more due to competition increasing, but you’re not necessarily getting more sales.
- No Baseline Revenue: Most of your new sales come directly from short term marketing activity (like in-market paid ads); hardly any new sales come to you directly from brand awareness (baseline revenue). And that’s okay, because you haven’t really built much brand (yet).
- Sales Ceiling: Hard to quantify exactly how many in-market buyers you can reach at any given moment or how many competitors are also trying to reach them, but if sales reach a ceiling unexpectedly, you may have hit, well, a ceiling.
Sounds scary right?
We have good news.
There’s a prescription for growing past the performance plateau: the Reach stage of the Marketing Maturity Mountain.
Reach Stage: Long-Term Marketing Engine
The goal of this stage is “future revenue and/or profit”.
Ramp stage brands eventually hit a performance plateau because they fail to reach and influence out-market buyers in advance of purchase, which is problematic because their small pool of in-market buyers eventually runs dry.
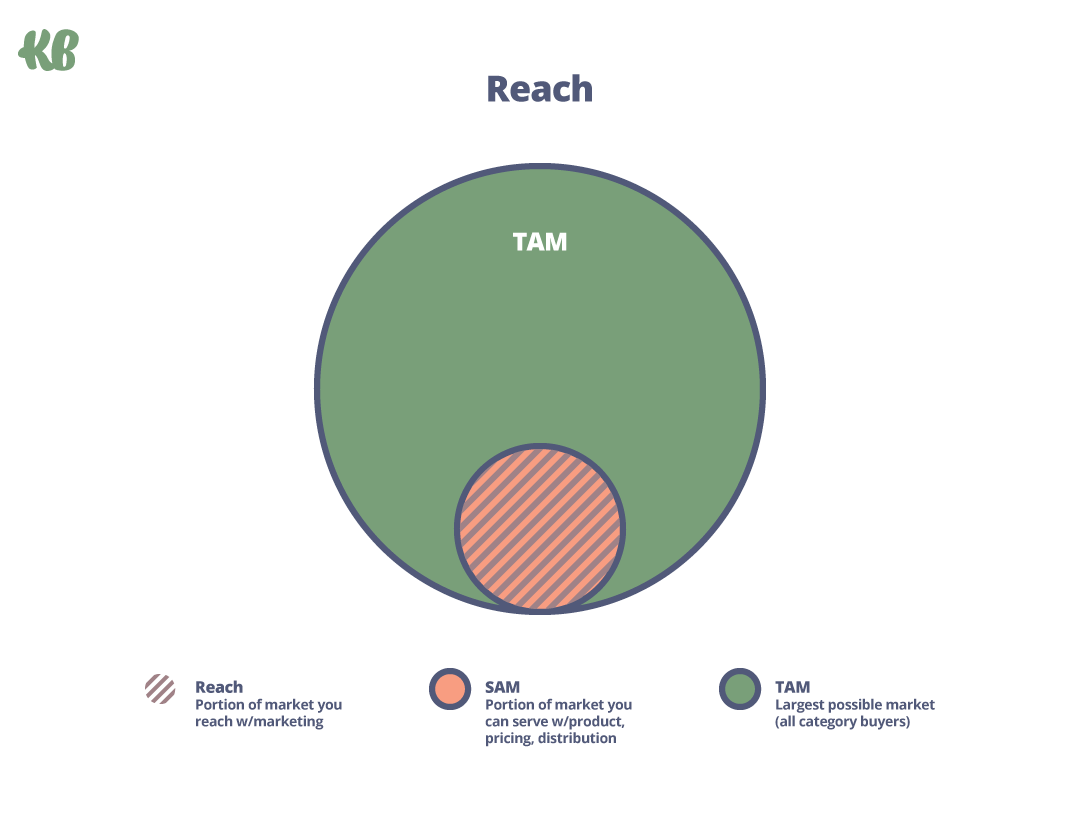
To grow beyond this plateau, brands need to expand their buying pools once again by reaching the biggest part of their SAM: out-market buyers.
This is where you want to build trust, credibility, associations, and memories with future buyers so more of them remember you when they move in-market.
Why are out-market buyers so important to long-term, sustainable growth?
Baseline revenue.
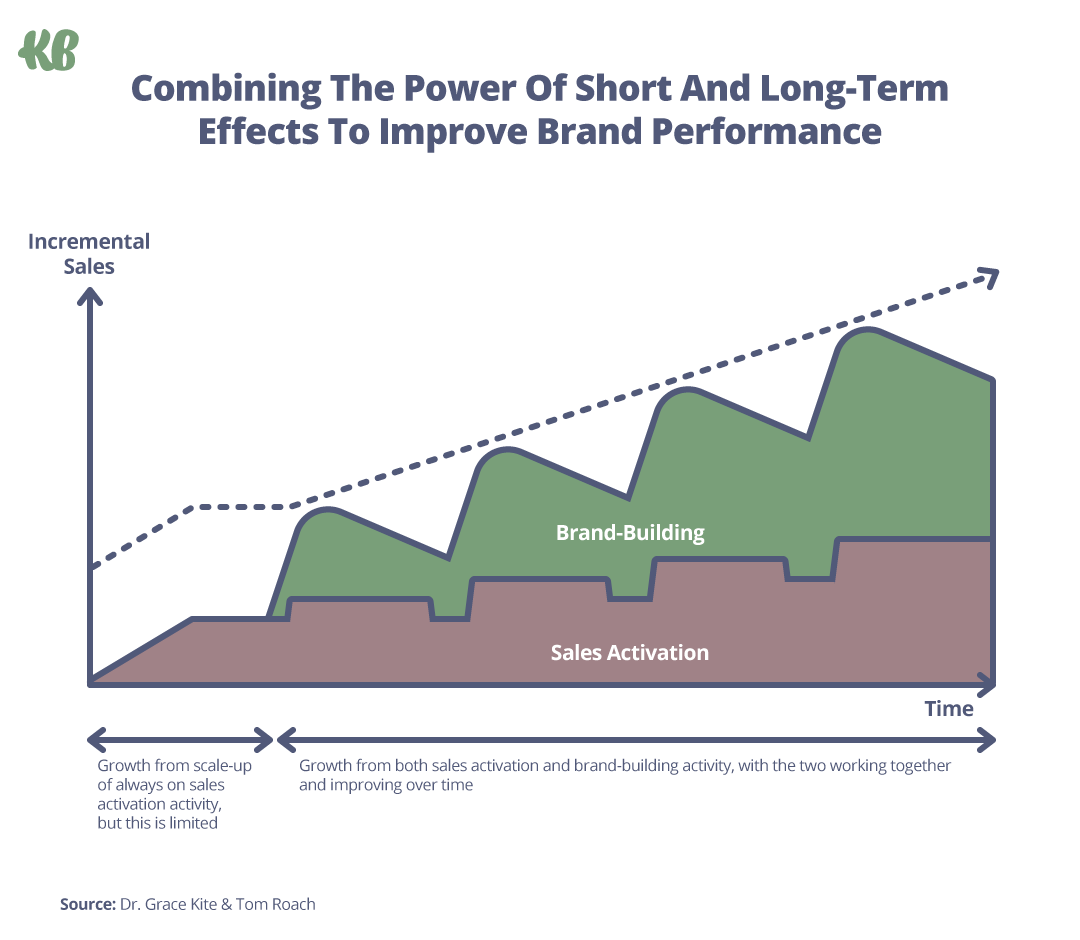
Baseline revenue is sales that come to you directly, unprompted by short-term, in-market, marketing activity or seasonality. For example, remove any in-market marketing activities from the Ramp stage and what do you get?
Baseline revenue and incremental revenue.
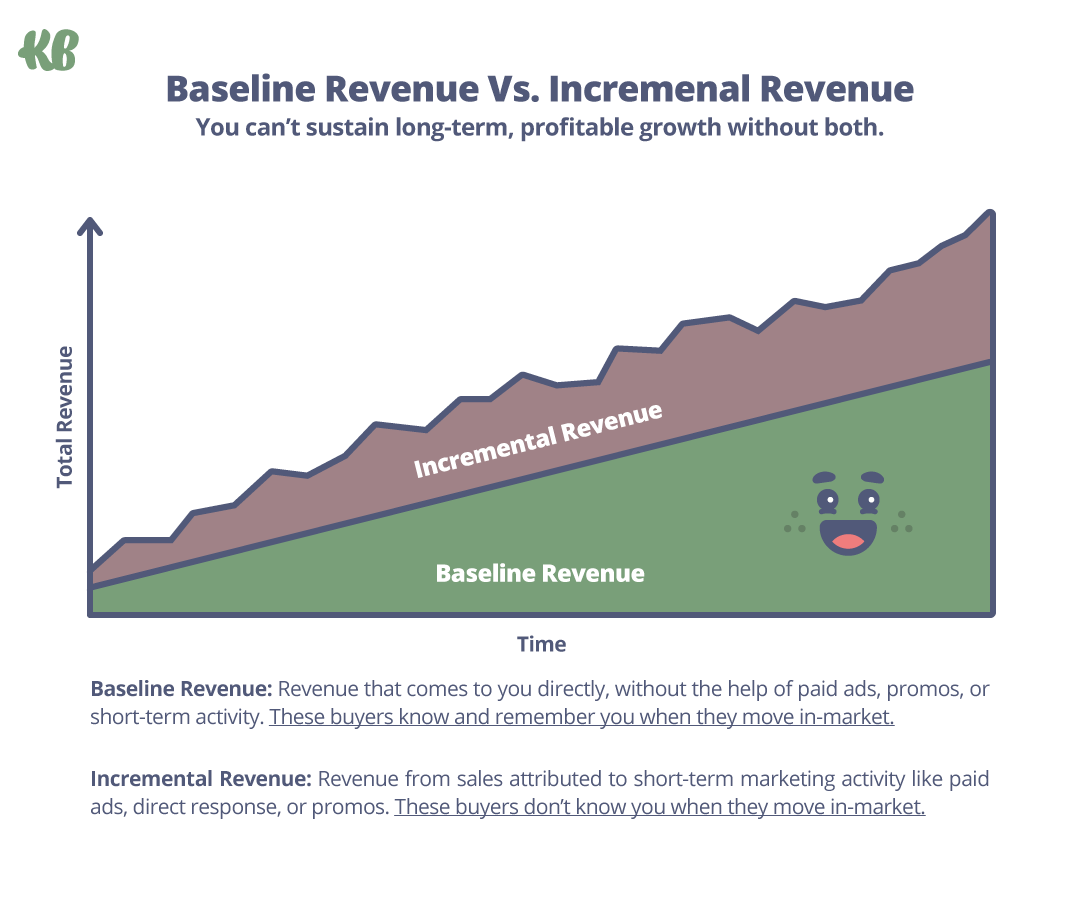
If in-market activity drives incremental revenue, then out-market activity (often denoted as demand generation and/or “brand building”, although they’re both different activities) drives baseline revenue. And as you can see in the chart above, baseline activity makes up the lion’s share of revenue long term.
How can that be?
First, like we mentioned before, out-market buyers make up the largest pool of potential buyers in your SAM (around 95%). There’s just more people to market too.
Second, what happens when you turn off your short-term activity but you’ve failed to establish a strong brand with future buyers? Or what happens during an economic downturn when budgets get pinched and short-term spending gets cut?
When spending stops, so does your growth.
Bottom line: you can’t sustain growth without balancing short-term and long-term marketing.
Penetration Level
Remember the 95:5 Rule mentioned earlier?
During the Reach stage, you’re no longer marketing solely to the 5% of in-market buyers within your SAM; you’re marketing to 100% of the buyers in it.
Reach Marketing Activities
With revenue leaks at the bottom of your funnel patched up during the Ramp stage, it’s time to fill the top of the stereotypical marketing funnel.
As a friendly reminder, keep in mind that you’re STILL doing all the (successful) previous stage (Validate & Ramp) activities.
- Demand Generation: Out-market activity that educates the market about the problems you solve and the ways you solve them. This is the umbrella marketing theme for this stage as demand generation can be done through multiple marketing strategies and tactics (ads, content, etc).
Your goal with ads (for example) is not to drive conversions but to educate your out-market audience “in-feed” across digital properties (LinkedIn, Meta, YouTube, Display, etc).
- Content Marketing: Distributing valuable and educational, pitch-slap-free content to your target audience across video, audio, and written ways, like blog posts, email marketing and social media channels.
- Account Based Marketing (ABM): The more 1:1 approach of marketing where the individual target account isn’t in-market, but a lot of personalized education and marketing effort is deployed as the LTV:CAC ratio proves worthwhile.
- Employee Advocacy: Turn your employees into social media advocates by empowering them with tools and resources to share your POV on their personal social accounts.
Note: During the Validation stage, it’s very common for founders to deploy organic activities like the ones we mention here because they don’t cost money, they only cost time (and founders, at that time, have a lot of it).
During this Reach stage, it’s time to make a real monetary investment in those organic channels so you can scale them for the first time.
Reach KPIs & Triggers
If the goal is out-market, future demand, sales, and revenue, how do you know you’re achieving it?
- Carry Over KPIs & Triggers From Previous Stage(s): Continue to maintain those KPIs and triggers within the marketing activities of the Validate and Ramp stage (example: 3:1 LTV:CAC ratio).
- Demand Generation: Since demand generation doesn’t have the expectation of immediate revenue like you’d expect from being in the Ramp stage, it’s important to have some specific KPIs you’re keeping an eye when your goal is to influence those future, out-market buyers:
- Pipeline (Lagging Indicator): Through digital attribution and self-reported attribution, you’re seeing signals of your demand generation efforts getting credit. People are mentioning organic social, podcasts, blog posts, ads, etc. You’re on the right track if you see at least 25% demand generation influenced pipeline after 6 months of executing.
- Revenue (Lagging Indicator): Pipeline is only cool if it turns into actual revenue. The similar 25% influenced revenue at the 6 month mark should be the goal. Because the out-market part of your SAM is always bigger than the in-market part of your SAM (95:5 rule), you should see a continuous growing percentage of the demand generation influenced pipeline as your demand generation budget also grows.
Here’s a good rule of thumb if you’re keeping your foot on the demand generation gas (and executing well on the leading indicators below):- 6+ months: 25% influenced revenue
- 12 months: 50% influenced revenue
- 18 months: 75% influenced revenue
- Analytics (Leading Indicators): Ensuring that you’re attracting the RIGHT type of traffic (reverse IP reveal for B2B marketers can help with this), you should start seeing these things happening:
- High-Intent Website Page Visits Increasing: 25% in 6 months
- Pricing Page
- Demo Page
- Product Page
- Time On Site Increasing: 25% in 6 months
- Strategic Content Pieces
- Blog Posts
- Self-Hosted Videos
- Etc
- Strategic Content Pieces
- Branded Paid & Organic Traffic Volume Increasing: 25% in 6 months
- High-Intent Website Page Visits Increasing: 25% in 6 months
- Ad Platform Consumption Rates (Leading Indicators): This is where you’ll start seeing deeper video view rates for your video ads, higher click-through rates, etc.
- Video View Rates Increasing: 25% in 6 months
- Click-Through Rates Increasing: 25% in 6 months
- Pipeline (Lagging Indicator): Through digital attribution and self-reported attribution, you’re seeing signals of your demand generation efforts getting credit. People are mentioning organic social, podcasts, blog posts, ads, etc. You’re on the right track if you see at least 25% demand generation influenced pipeline after 6 months of executing.
VITALLY IMPORTANT NOTE: Make sure you set baselines on these KPIs BEFORE you start your demand generation efforts so you’re confident you’re moving in the right direction.
- Content Marketing: This is a catch-all term for any content you create that also follows the demand generation KPIs we shared above (25% increase in 6 months).
- Account Based Marketing (ABM): LTV:CAC ratio of 3:1.
- Employee Advocacy: Through self-reported attribution, get a sense of the % influenced pipeline AFTER 6 months of great execution.
How do you know execution is great? Use a tool like Shield Analytics on LinkedIn if you’re B2B and see your employees follower count and engagement increase.
THEN, measure the cost per thousand impression (CPM) difference between employee advocacy and your other ad channels.
You SHOULD find that your employee advocacy CPM is lower than your ad platform one.
Lastly, all you have to do is compare the attribution weight (digital and self-reported) against the employee advocacy side and ad platforms.
Here’s your goal equation: Employee Advocacy CPM < Ad Platform CPM when it comes to influenced pipeline. - Business KPIs: By now, your previous stage business KPIs should have changed. You may have more overhead, but you may also have improved your LTV. You should still be able to maintain a minimum of that magical 3:1 LTV:CAC ratio.
Here are some new business KPIs to start paying attention to:- Baseline Revenue: Any marketing activity designed to measure future sales should look to baseline sales and revenue as its lagging indicator. If you’re building a stronger brand that more people know and like in advance of purchase, more of those people will come to you directly when they move in-market.
This KPI is hard to measure as you would have to turn off all your short-term, in-market, marketing activity to see what baseline sales you’re getting.
The good and bad news is that your attribution tracking will miss a lot of new revenue simply because attribution tracking isn’t perfect, and the positive impression your marketing made on an out-market individual 12+ months ago might finally coming to fruition (without being tracked through your attribution software).
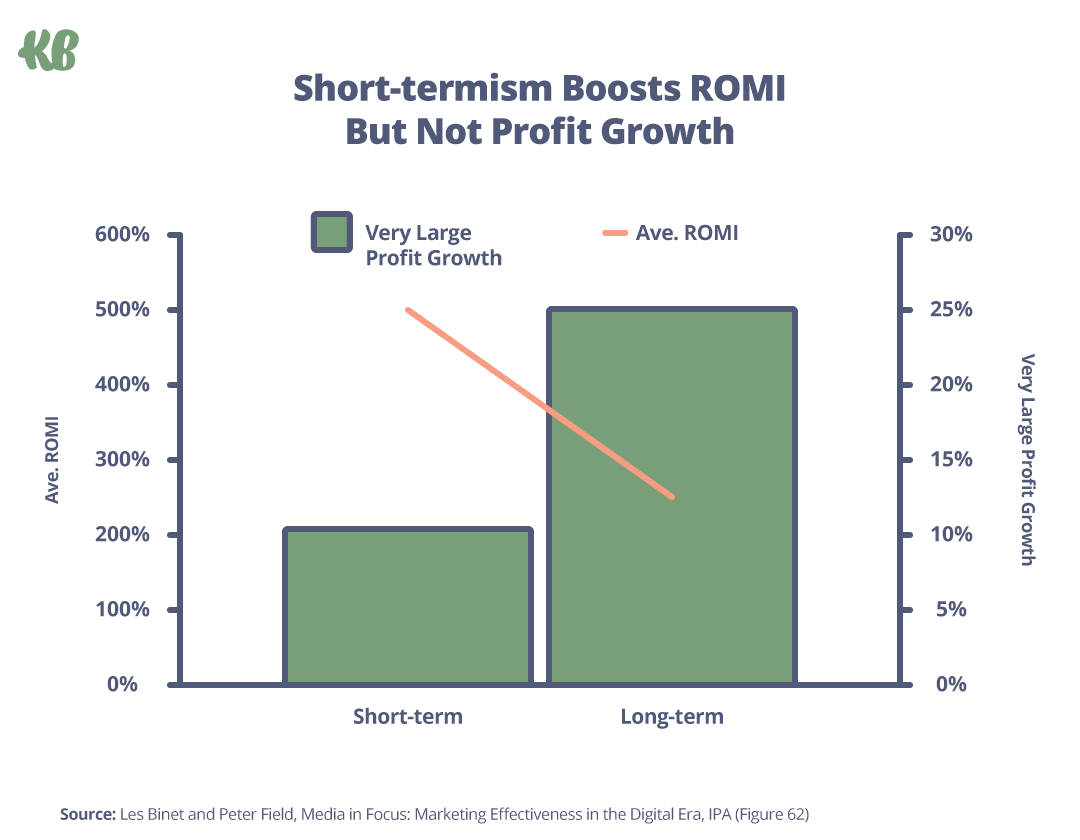
Profit Growth: In the Validate and Ramp stages, profit matters less than cash flow and revenue. With little brand equity built, you’ll have marginal influence over price sensitivity. However, as you start marketing to out-market buyers, and start growing brand affinity, you gain power over pricing, making it easier to grow profit.
With this business KPI, profit ($) and profit margin (%) varies wildly from business to business.
Our point here is that you should expect to be able to start achieving higher targets of profit margin and overall profit.
How long can you stay in the Reach stage?
Again, it depends on the size of your TAM.
Marketing to 100% of your SAM could line your pockets for years, driving well over $20 million in annual revenue.
But if you have a small and overcrowded SAM with only a few thousand buyers, you'll likely exhaust that pool much quicker.
Like we saw in the Ramp stage, if you stay in the Reach stage too long without expanding your SAM, you’re also headed for ANOTHER plateau: the penetration plateau.
Penetration Plateau: Outgrowing Your SAM
Another plateau?
We know, so sorry.
This time it’s a penetration plateau: when you outgrow your SAM and need to expand your pool of buyers to include new SAMs within your TAM.
Penetration Plateau Triggers
How do you know you’ve hit a penetration plateau?
- High Penetration Rate: How much of your existing SAM have you penetrated? If it’s above 50%, it’s time to start thinking about expanding into a new SAM to include new segments in your TAM (we’ll talk about that in the next stage, the Supply stage).
- Flattening Baseline Revenue: When baseline sales and revenue begin to flatten, you know you’re maxing out the effectiveness of your reach. It’s time to reach for more.
But we have good news (again).
There’s a prescription for growing past the penetration plateau too: the Supply stage of marketing maturity.
Supply Stage: Market Expansion
The goal of this stage is “market penetration”.
By this stage of the Marketing Maturity Mountain™, you have an efficient and effective marketing engine targeting both in-market and out-market buyers within your first (or multiple) SAM(s).
But at some point, you’re going to outgrow your SAM and hit another penetration plateau (yea, each SAM has its own performance and penetration plateau).
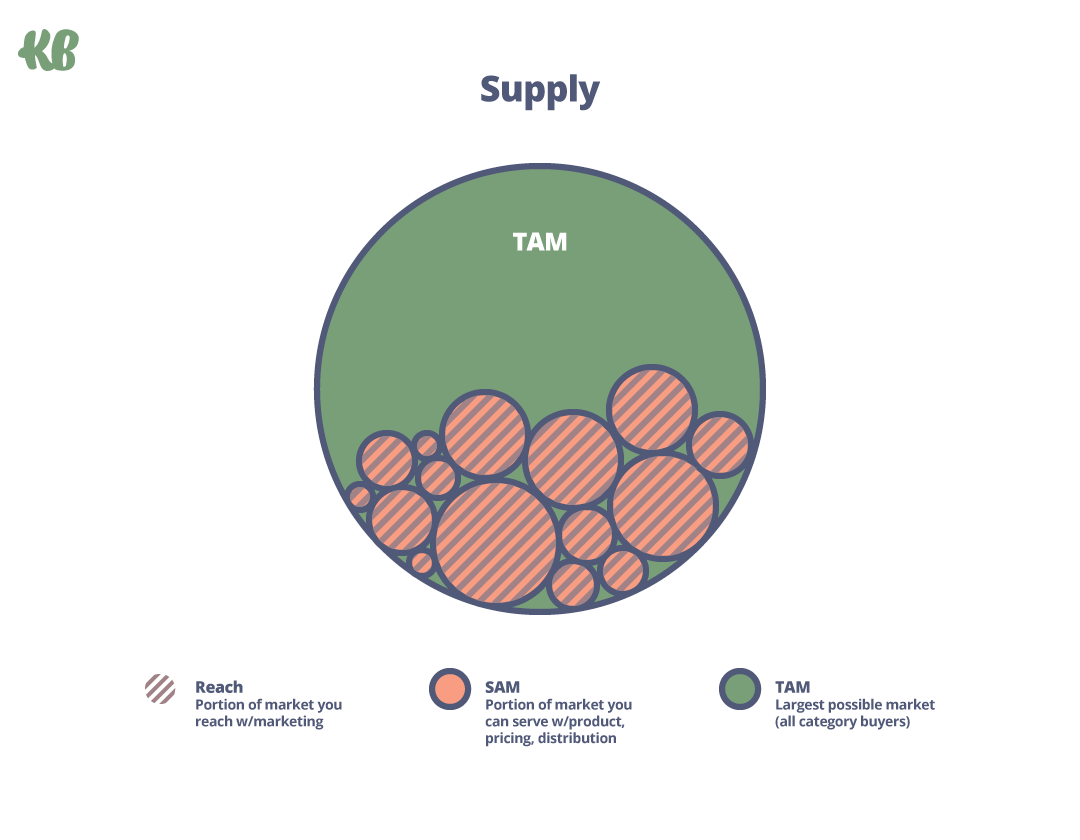
The only way to expand your buying pool beyond your SAM is to create more SAMs within your TAM. And you can’t do that without leaning heavily on some of the original “4 Ps” of marketing, specifically: product, pricing, and place.
In other words, how you supply demand:
- What you’re selling = product,
- For what = pricing
- For who = place…
…becomes much more of a focus now than ever before.
Therefore, the Supply stage is all about physical availability: selling more different things to more buyers within your TAM by growing your existing SAM(s) or creating new SAMs.
This is where market penetration starts to take off.
Penetration Level
You don’t just become physically available for your entire TAM overnight. But by now, you’ll have the resources to invest in new product development (product), new feature variations at different price points (price), and more global distribution (place).
Your original SAMs either now starts growing much bigger and/or you’re creating new SAMs within your TAM because you can service much more of your TAM.
Supply Marketing Activities
By now, you should face a reality that you can’t close all the leads or website visits you’re getting.
That’s because your original SAM was meant for a specific ICP.
Back then, you couldn’t sell to buyers that couldn’t afford your product and you might not have been able to close enterprise type buyers either.
For us at KlientBoost, only about 25-30% of all our leads fit our ICP. So why don’t we try to create new supply for the remaining 70-75% of leads we’re already getting?
We are!
Years back, we sold over $100,000 of our KlientBoost Academy™ with very little marketing effort (all it took were some email marketing initiatives).
If we can create a new product that ALSO benefits internal learning and can be sold externally, then we’re killing multiple birds with a single stone.
So now, think of how you can increase the “supply” of the demand that’s already out there.
That’s partly what this stage is for.
Think of how you can create brand new offerings (product) and how that can be sold at lower or higher entry points (pricing).
Then, start thinking of how you can take your original SAM and expand geographically (place).
- Product Development: Now is the perfect time for a second product - when you have a well-run marketing engine and just need to replicate it to a new segment with a new product.
- Product Marketing: At this stage, it’s time to invest in a full product marketing team who can strategize, launch, and manage new product and segment go-to-market strategies side by side.
- Pricing & Packaging: Packaging at different price points is an easy way to expand your buying pool to include different income or budget levels without building new products entirely (create “light/lite” versions of your original product for example).
- Geographic Expansion (Place): For many, geographic expansion might not even require new products or pricing; it may just require new marketing programs in different languages and through different platforms, and maybe new sales people.
Supply KPIs & Triggers
What metrics should you track to measure the effectiveness of your SAM expansion via product, pricing, and place?
- Carry Over KPIs & Triggers From Previous Stage(s): Continue to maintain those KPIs and triggers within the marketing activities of the Validate, Ramp, and Reach stage (example: 3:1 LTV:CAC ratio).
New products will have to follow the same Marketing Maturity Mountain™ stage growth and KPI & trigger requirements. - Penetration Rate: What’s your penetration rate within each SAM that you’re targeting? Then what’s your total TAM penetration rate?
This is now something you should be tracking and you saw it earlier in this article:- Targets who buy your product/targets in your SAM = SAM penetration rate
- Targets who buy your product/targets in your TAM = TAM penetration rate

There’s no specific guideline here, but you should see this number start going up and to the right.
- Upsell/Expansion: With more ways to serve more buyers, it’s easier to upsell, cross-sell, and/or expand revenue.
You should aim for a 20% revenue expansion goal (selling new products to current customers).
- Average Contract Value/Average Order Value (ACV/AOV): With more ways to serve more buyers, you should also see average order size or average contract value go up.
- Net Revenue Retention (NRR): NRR indicates how much money your business is making from its existing customer base after accounting for any losses. With more products to sell, you should see NRR go up - meaning that even if some customers churn, you’ve done a good job of getting existing customers to keep buying more that revenue keeps climbing.
Once you’ve mastered in-market buyers, out-market buyers, and SAM expansion, it’s time for the fifth and final stage of the Marketing Maturity Mountain™: Sustain.
Sustain Stage: Growth, The Sustainable Kind
The goal of this stage is “sustainable growth”.
It’s not everyone who can climb the Mt. Everest of marketing, but here you are.
At this stage, you now (almost) have a sustainable growth engine:
- Validate Stage: Product-market fit with a sustainable portion of your SAM
- Ramp Stage: Short-term (in-market) acquisition and sales engine
- Reach Stage: Long-term (out-market) demand gen engine
- Supply Stage: Multi SAM creation to cover more of your TAM
What’s next?
Two things.
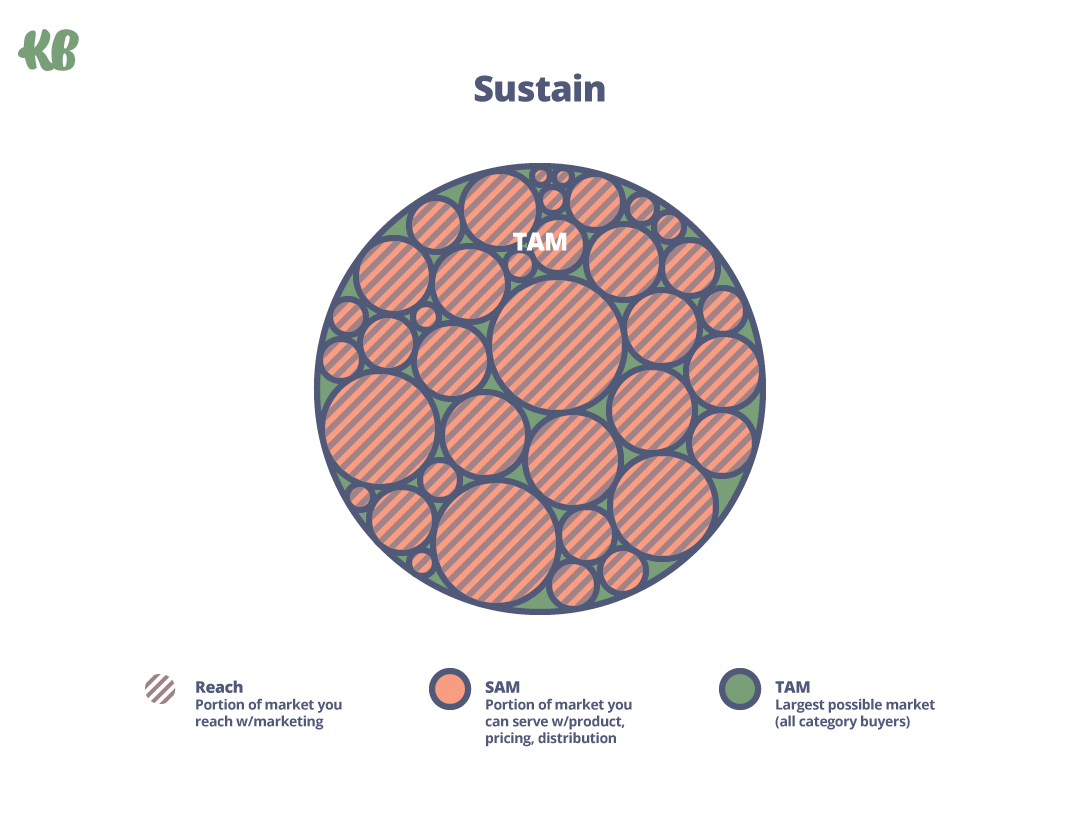
First, replicate your sustainable growth engine across new SAMs until eventually you sell to all category buyers, not just some of them.
Now, your SAM(s) will BECOME your TAM.
Second, pour on the brand activity - it makes the most sense now more than ever.
Why?
Because in every mature market, the biggest brands in the category compete on brand, rarely on differentiation or features (since both are so easy to replicate by competitors).
For example (and as you learned from earlier) Mailchimp is one of the most undifferentiated brands in the category, yet they have the biggest brand in the category by A LOT (66% market share vs the next closest 9% market share).
Which means more people who can buy from them consider them and remember them when it’s time to buy.
Penetration Level
How many companies sell to every single buyer in our global TAM?
Probably none.
Even Apple and Coke don’t have perfect reach and distribution. And even Apple and Coke have to continue both product and marketing innovation to keep market share and/or grow it.
The point of this stage is to grow your SAM(s) until they’re big enough to sustain growth in perpetuity.
In other words, expand your buying pool so big that you won’t have to worry much about expanding it again.
And pat yourself on the back. You’ve reached the promised land.
Sustain Marketing Activities
Broadening your original SAM or creating new SAMs create brand building opportunities.
How?
Brand building is a reach game. And if you’re physically available for most of the people you’ll reach with your brand activity, your brand activity starts to work harder and more efficiently.
Now, you can reach further and wider knowing that many of the people you reach can actually buy from you.
Not to mention, brand activities (when executed well) will start improving the metrics of ALL OTHER stages on the Marketing Maturity Mountain™ (more data on that further below).
IMPORTANT REMINDER: All of the previous stage marketing activities are plates you’re STILL spinning.
- Brand Advertising: Marketing activities in the Reach stage focused on reaching buyers with rational information about the problems you solve. Marketing activities in this Sustain stage are about universally relevant messages and emotional campaigns that resonate with and get remembered by all category buyers. For example, Upwork’s This Is How We Work Now.
- Brand Activations: These are one-off events, experiences, series, concepts, or organic campaigns designed to earn fame by spotlighting hot topics (newsjacking), data, partnerships, products, or POVs in an original and memorable way. For example, Liquid Death’s Enema Kit with Travis Barker.
- Broader-Reach Channels: Even B2B brands like Gong leverage broad-reach channels like TV (that’s their actual SuperBowl commercial - the pinnacle of brand advertising), Connected TV (cTV), OTT, streaming, and sponsorships to reach future and current buyers. The bigger your serviceable market, the more reach you’ll need.
Sustain KPIs
What new metrics do you need to add to your dashboard to ensure your new brand activity is reaching and influencing all category buyers?
- Market Share: At this stage, the ultimate sign of marketing effectiveness is market share. Period.
You wanna be the category leader? Then you gotta have the highest % of market share compared to your competitors.
The equation looks like this: Your Revenue/Industry Revenue X 100 - Share of Search: Calculate the organic search volume your brand garnered within a particular time frame, then divide it by the total searches received by all brands within your industry at that same juncture.
Same thing as market share, your goal is to have the highest % of share of search.
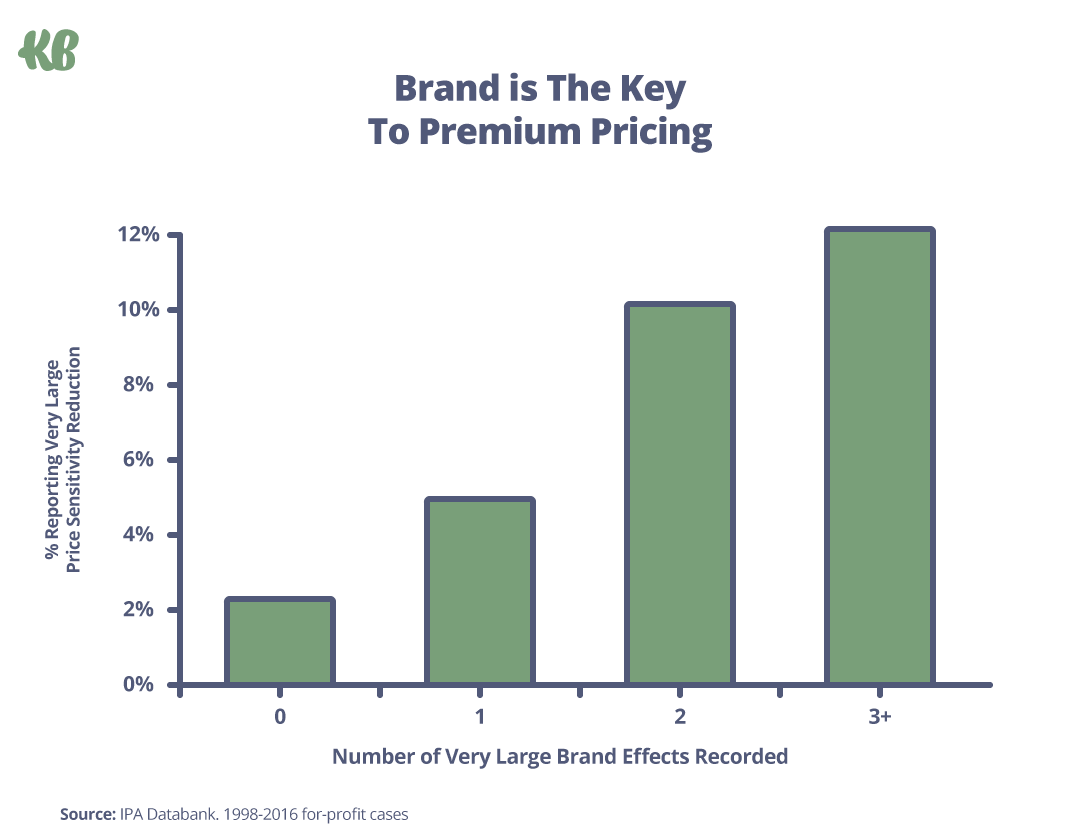
Pricing Power: Strong, mentally available brands reduce price sensitivity in buyers, become more resilient to price competition, and can charge more.
This should allow you to increase your profit and profit margins because simply put, more people love your brand compared to the competition.
- Profit: If you can charge more (or maintain margins in the face of price competition), you can also take home more absolute profit. Good news: while long-term brand activity costs more, it also makes more.

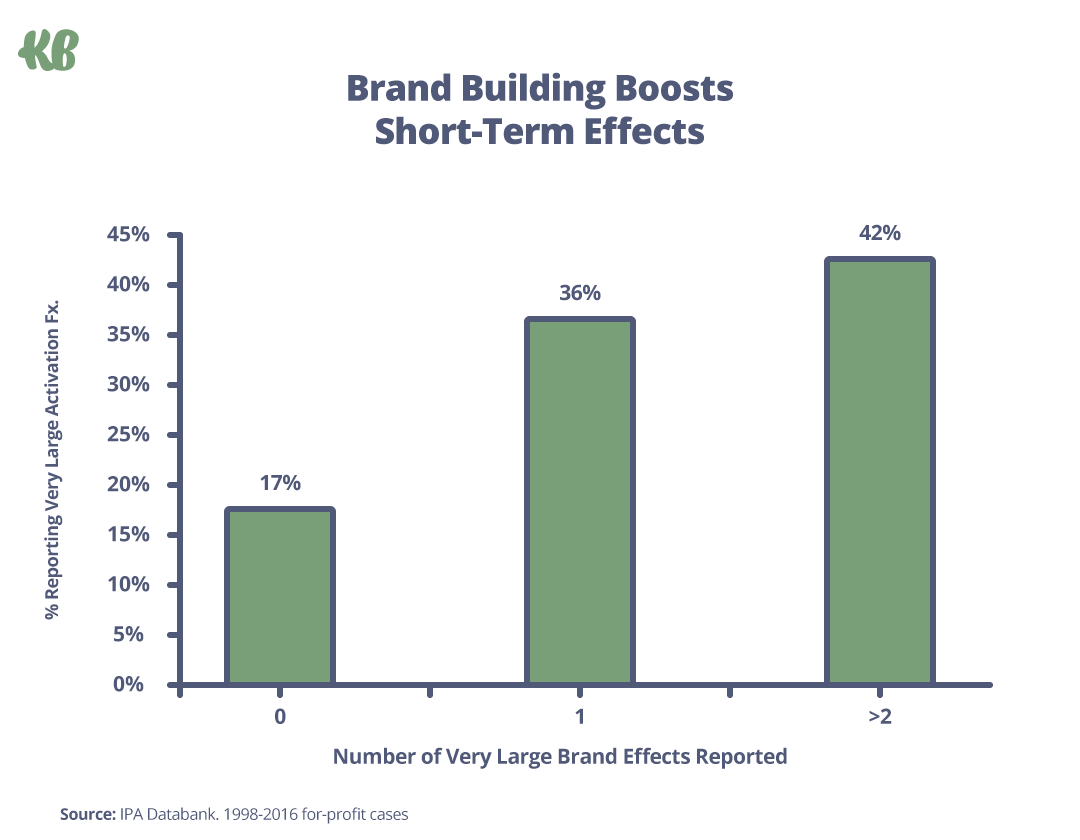
- Short-Term/Long-Term Efficiency: When you’re physically available for everyone you’re also mentally available for, marketing gets super efficient. But strong brands also convert higher at the bottom of the funnel.
- Loyalty/Retention: The good news keeps coming.
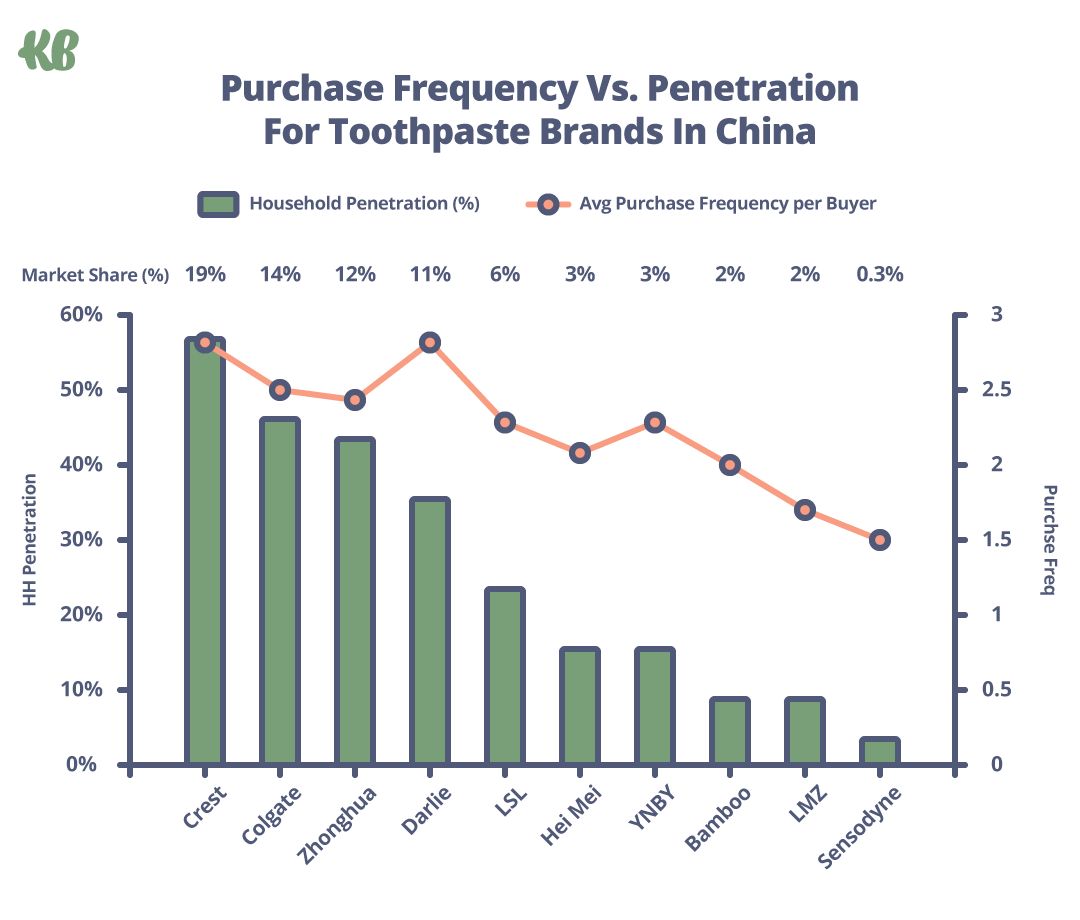
Loyalty/retention is a function of your size of business. The biggest brand in the category also has the highest loyalty.
It’s called the Law of Double Jeopardy.
Why?
Well notice how high market penetration leads to higher purchase frequency too.
And you thought Colgate was the leader, didn’t you? 😉
Marketing Maturity Mountain™ FAQs
How long should each stage take?
It depends on how fast your reach plateaus within your original SAM (and future SAMs you build out) AND the size of your TAM.
For example, we already mentioned we’re a marketing agency with a huge TAM.
We’ve comfortably scaled to $20M in annual recurring revenue doing mostly Ramp stage activity with a sprinkle of Reach stage. But for many with smaller TAMs, that’s not possible.
Either way, none of this will happen fast. Marketing maturity is highly dependent on capital, resources, and expertise, and none of those things happen fast.
How will marketing activities change over time?
As you mature through each stage (Validate, Ramp, Reach, Supply, Sustain), your marketing activities need to mature as well.
You’re not replacing marketing activities as you mature; you’re continuously improving them (remember how reaching the Sustain stage improves all KPI performance in the prior stages).
For example, your Google Ads strategies and tactics will look similar from the Ramp stage to the Sustain stage but with more advanced strategies and tactics within the Google Ads ecosystem (think YouTube and Display for example).
What if I’m a small business with a small TAM?
All good. This model still works.
Though you’re likely never going to participate in Sustain stage marketing activities: TV advertising, national billboards, etc, the process of expanding your buying pool over time is still the secret to avoiding sales plateaus and sustaining growth - only for you, that expansion will be smaller.
Wrapping Up
Growth doesn’t come from dropping a new engine in your business and racing past everyone.
You can't just adopt the latest framework, fundamental, philosophy, trend, or empirical law and expect growth. Not even this one.
Growth is a complex mess.
Like, really complex.
We can simplify it, but we’ll never be able to capture the complexity of markets and industries within a single framework or motion.
- Business models
- Business stage
- Skillset
- Resources
- Funding
- Industry
- Economic climate
- Timing
- And a litany of things totally out of your control
They all matter.
And no framework can perfectly capture the diversity of those elements across all businesses.
It’s up to us, the marketers, to adapt the framework to our situation as it changes over time.
Sustainable growth comes from adapting to our ever-changing business landscape while respecting the fundamental principles defined in the Marketing Maturity Mountain™, namely market penetration.
The way you approach marketing will look different than the way someone else approaches it, and it will even look different for you at different times depending on your circumstances.
And that’s a good thing.
But one thing will remain the same: no matter who you are, at some point, to keep growing, you’re going to have to expand your pool of buyers.
Now go forth and grow.
Sustainably 😉
P.S.
Massive gratitude to the original father of the Marketing Maturity Mountain, Drew Leahy ❤️
