If you’ve ever been to a carnival or circus, then you know there are endless possibilities for amazement.
The activities and exhibits are odd, weird, delicious, and downright entertaining.
But what’s not entertaining is when you have a hard time figuring out what does what when it comes to your PPC attribution. Does your display advertising help search activity, or do your social ads stifle your retargeting goals?

Those are the questions we’re here to answer. With our partner Marketo, we’re diving deep into your PPC analytics. You'll be able to see your true performance even when your campaigns don’t seem to generate any conversions.
Get brand new PPC strategies straight to your inbox every week. 23,739 people already are!
When it comes to your PPC campaigns and Google Analytics, there are six different attribution models to choose from.
These attribution models help shift the conversion credit to different parts of your PPC customer journey.
Because almost all attribution modeling gives the conversion credit to the last click, you won’t know if other types of PPC campaigns assist others in the conversion process.
And if you don’t know that going in, you may pause campaigns, ad groups, and ad sets prematurely because they don’t seem to be converting for you.
Also, as you start testing these different PPC attribution models, keep in mind that there won’t be one perfect model for all of your traffic.
Your goal with these is to find correlations between campaigns.
We'll have more on these attribution models in the bottom section.
Now that you know the different types of attribution models, the next step is to see which model allows you to be actionable.
Because without actionability, data is quite useless.
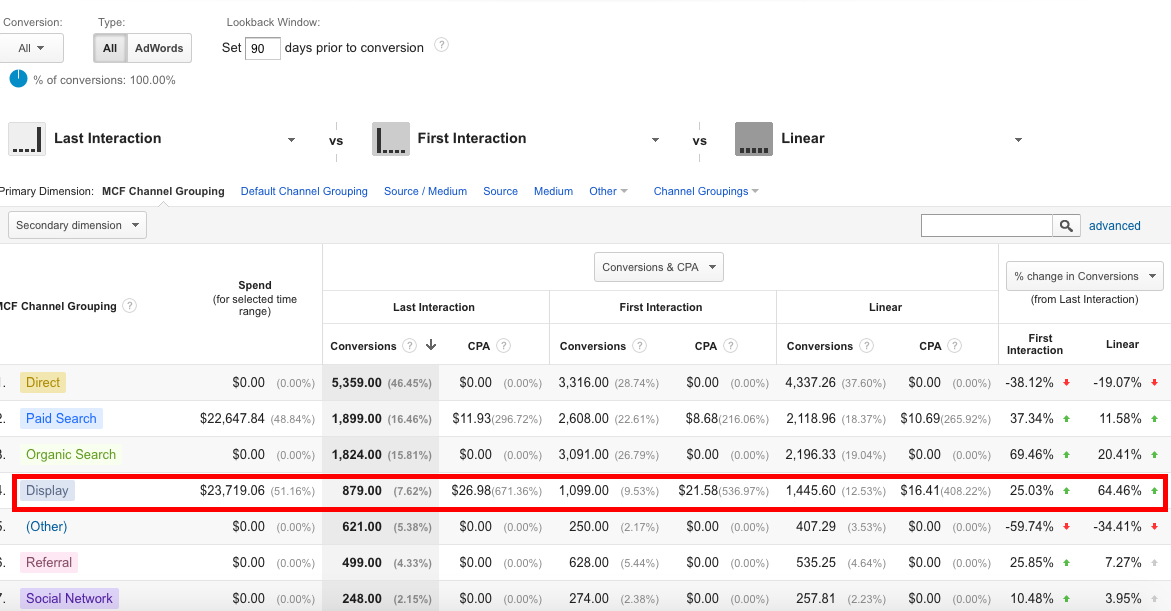
To see different attribution models, go to your Google Analytics account and click Conversions > Attribution > Model Comparison Tool.
Once you’re there, you can start comparing different attribution models side by side, and see the breakdown across different PPC traffic channels.

If your Google Analytics account looks like the screenshot above, you can see that a lot of conversions start with your display campaigns, but they don’t necessarily end there.
That could mean that your display campaigns are doing great, even if they’re not driving last touch conversions.
As you slice and dice your data, you’ll find that with enough traffic volume, every keyword, ad group, and ad set can have unique PPC customer journeys.
It’s up to you to figure out which PPC attribution models are the most common across your entire set of traffic.
To collect your PPC attribution data effectively, you'll need to tag all of your channels properly.
This means using manual UTM parameters or something like automatic ValueTrack parameters.
For manual UTM parameters, you’ll want to be able to turn a regular link like this:
klientboost(dot)com/ppc/ppc-attribution
Into something like this:
klientboost(dot)com/ppc/ppc-attribution?utm_source=facebook&utm_medium=social&utm_campaign=blogpromo
Each part of this URL string can be understood as follows:
- utm_source: Where the origin of the traffic is coming from. This is usually kept at the website level.
- utm_medium: This is the parent channel of where the traffic is coming from -- email, social, search, etc.
- utm_campaign: This is a narrowing down of your actual campaign that you’re running and the naming convention you’re giving that campaign.
To learn more, I highly recommend you read our friends Effin Amazing’s guide to UTM parameters.
Just like your visitors jump across different channels before they convert, they do the same thing across different devices too.
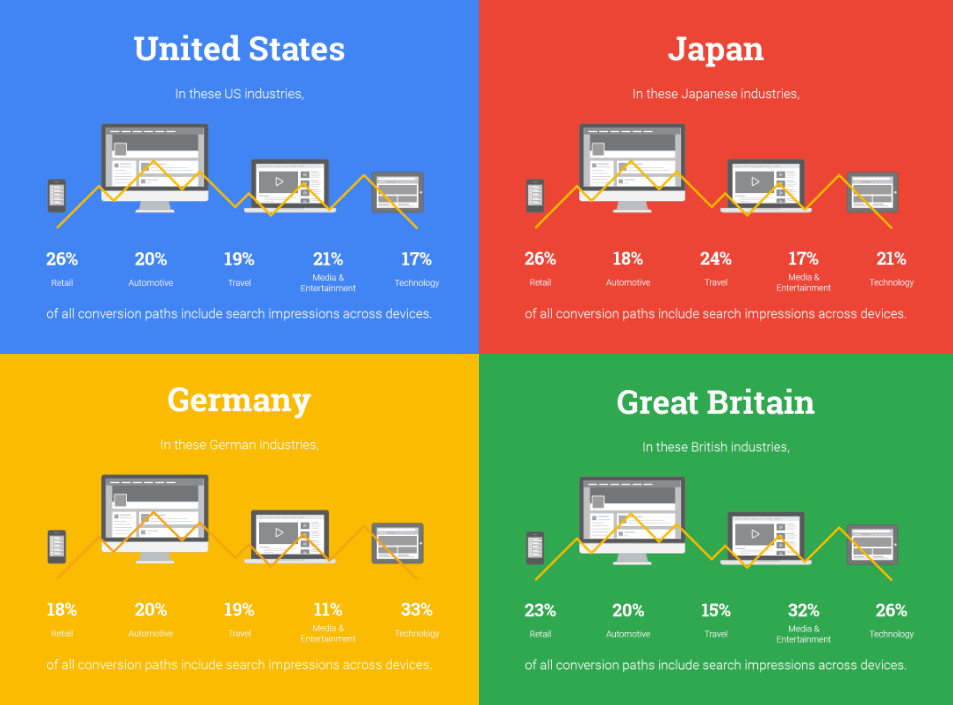
According to Google research, there are different paths that are easily seen across different countries.

In addition to this, and if your visitors are able to be tracked across devices, then you can see additional device attribution reports inside your Google Ads account.
You can run three different reports with this information:
- Devices: See how often visitors use different devices when it comes to your Google Ads campaigns.
- Assisting Devices: Improve your device bid adjustments by seeing which devices assist others.
- Device Paths: See the top conversion paths for visitors who use two or more devices.
There’s a good chance by now that you may be scratching your head. And I don’t blame you.
But now that you know what PPC attribution is, it’s time to see which attribution model gives you the most valuable and actionable data.
Here’s a look at the most common ones you’ll find in your Google Analytics account:
Last Interaction: This is where the last click gets 100% of the credit for the conversion.
Last Non-Direct: all direct traffic is ignored, and 100% of the conversion credit goes to the channel, not the individual keyword or campaign. An example could be the email channel.
First Interaction: This is where the first click gets 100% of the credit for the conversion.
Linear Model: Each channel or click would get an equally distributed credit for the conversion. If there are four touchpoints, then each point would get 25% conversion credit.
Time Decay: This is where the touchpoints (channels and clicks) closest to the conversion get the most credit. If social and email received clicks a few hours before conversion, but display and search clicks happened a week ago, then social and email would get most of the credit.
Position-Based: In this model, 40% credit is assigned to each of the first and last interaction. The remaining 20% credit is distributed evenly to interactions that happen in-between.
Now that you know what PPC attribution is, the next step for you is to act on the data you have.
If you have a hard time seeing the correlations, you may not have enough traffic or conversion volume. That’s okay. The best thing for that is to still keep your focus on the last-click attribution piece.
What insights have you gained from your PPC attribution data? Does display fill the top of the funnel?
