


Are you satisfied with your current conversion rate?
The average conversion rates (CR) are between 1.84% and 5.01% depending on the industry, but the optimal CR is above 10% across the board.
What can you do to improve it?
Well, there are several reasons why a prospective customer may not convert on your offer. It could be something like your traffic quality or even your landing page itself.
This is where conversion rate optimization (CRO) steps in to strengthen your marketing strategy. But in order to improve your conversions, you need to know what’s not working and what is.
How do you figure that out?
Conversion metrics (CRO metrics) come in handy when researching data like this.
In this article, we’ll go over six CRO metrics you should track across different digital marketing channels—from SEO, to PPC, to landing pages—and let you in on our best practices to lift your conversion rates.
Once you set up Google Analytics, you’re ready to start looking at your metrics.
Get brand new conversion strategies straight to your inbox every week. 23,739 people already are!
1. traffic sources
A great tool to see what sources drive the most traffic to your website is Google Analytics (GA).
GA conveniently separates traffic sources into several categories, but the most important categories to pay attention to are
- direct
- search
- referral
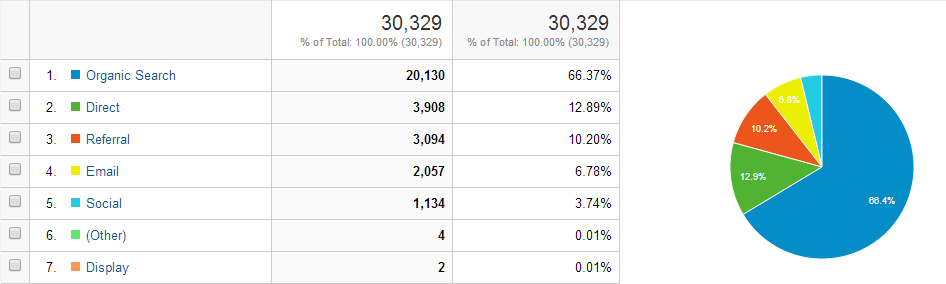
Direct
Direct visitors are website visitors who go to your site by using a bookmark or directly typing your URL into their browser address bar.
Search
Search visitors are website visitors who find you through a search engine, which includes both organic search and paid search. In fact, 53% of website traffic comes from organic search, making it one of the best sources for converting traffic.
Referral
Referral visitors are website visitors who click through a link to your site from another site, like a blog. The best traffic source for referrals is social media, as prospective customers are 71% more likely to purchase based on social media referrals.
Tip: prioritize the best-performing traffic source
Engagement levels vary by traffic, so track each traffic source individually to see which is performing best. You’ll see what avenues bring better results, which allows you to invest more in those specific sources.
While it may be tempting to only invest in one source, it can be risky. So, continue to diversify ad spend but focus your marketing efforts proportionately.
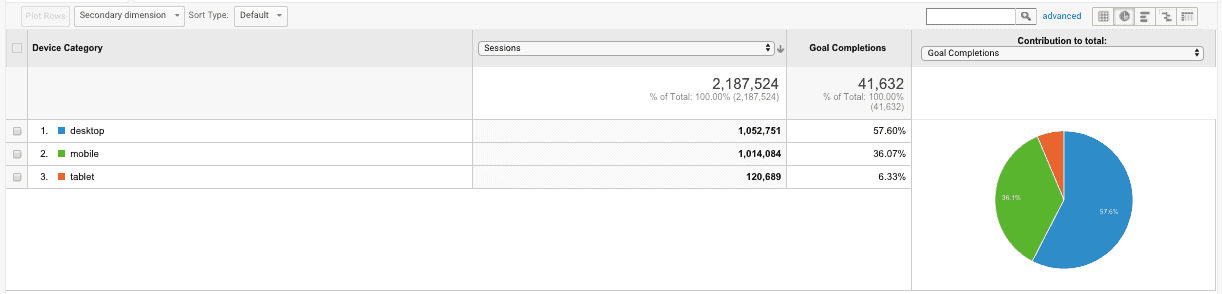
2. mobile vs. desktop visitors
Perficient found that 68.1% of all website visitors came from mobile devices in 2020, so it’s good that you can sort website visitors by device in Google Analytics.
As mobile usage continues to rise, it’s becoming increasingly more important to create a mobile-friendly site.
Tip: design for mobile first
Responsive design is essential to consider when building a landing page or website so that the experience is top-notch across all devices.
In our blog about website optimization, we talk about how to design for mobile first, including how to make main actions accessible and avoid extensive scrolling.
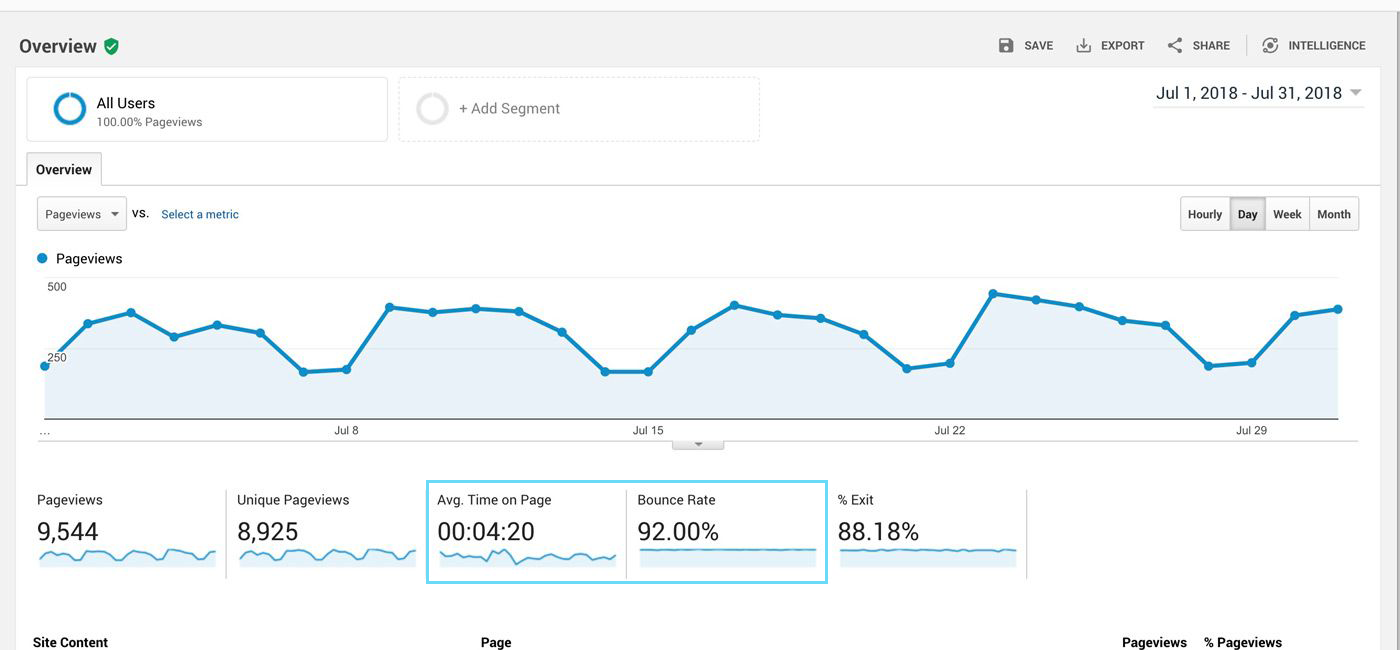
3. bounce rate
Bounce rate tracks the number of website visitors who come to your site and immediately leave or don’t take a secondary action, like clicking a call-to-action (CTA) button.
Google Analytics calculates bounce rate by the total number of single-page sessions divided by the number of all sessions on that page.
Average session duration, or average time on page, is the average amount of time a user spends on your page, which can be used alongside bounce rate to see if your users aren’t spending enough time on your page.
Tip: lower your bounce rate
The benchmark bounce rate is 26%–40%; a high bounce rate on your landing page leads to lower conversions.
Qualities that may contribute to a high bounce rate are
- poor design
- high load times
- low usability
But many causes of a high bounce rate can be remedied by integrating user experience (UX) principles into your landing page. Here’s some of our favorites tips to improve user experience so that you lower your bounce rate and get more conversion.
4. form completions
Form completions, a type of lead generation, are an essential part of CRO metrics, as they help put potential customers on a buyer’s journey.
With a solid sales track, you can nurture them into taking your desired action and becoming paying customers, thus making form completions a high conversion process.
Tip: use the Breadcrumb Technique on your forms
The Breadcrumb Technique can double your landing page conversion rate 🤩

Our free marketing plan uses a form
We know this because we use this technique for our clients’ lead gen landing pages, as well as our own website, to improve landing page conversion rates.
Learn more about how to implement this technique and increase your current number of conversions here.
5. total number of visits, sessions, or page views
It’s important to know the number of users—new customers and returning visitors—who visit your webpage, homepage, or landing page, to determine how well your campaigns are performing.
Tip: evaluate your new visitors and return visitor conversion rates
New visitor conversion rate
First-time visitors interact with your website differently than returning visitors.
Improve your new visitor CR by first isolating this metric from returning visitors. Then, think about what a new visitor might see in the few seconds they look at your website.
Once you understand the first impression you make, you may uncover underlying UX issues that impact optimization.
Return visitor conversion rate
Returning visitors are a bit trickier.
Why didn’t they convert the first time, but choose to return for another look?
The good news is that you left a good enough impression for them to come back. But this is when it can be difficult to pinpoint what exactly needs to change to convert them.
We suggest you check out our next tip to convert these visitors.
6. click-through rate (CTR)
CTR is determined by the number of visitors who visit your website by clicking on your ad (Facebook ad, Google ad, etc.). It’s calculated by dividing the number of clicks by the number of impressions (the number of people who saw your ad).
With this metric, you can gauge how well your audience is reacting to your ad creative.
Tip: run tests
A low CTR shows you that your ads aren't appealing to your target audience.
If you conduct A/B tests, you can figure out what ad creative works best for your audience and improve your CTR, consequently improving your conversions.
17% of marketers already run tests like these to improve their conversion rates.

To learn more about CRO testing and how to do it effectively, read this.
Time to start implementing
Congratulations, you have six of the basic CRO metrics down, along with some of our go-to tips.
We’re excited for you to start using them, but we’re even more excited for how you’ll use them to get even more conversions.
Once you establish your KPIs, whether PPC or SEO, you can start to see if you’re truly optimizing your conversions and hitting your goals.
Good luck.
And if you want to know what other conversion rate optimization elements you can improve, start with a CRO audit. Or just call us. 😉


